Introducing the all new DTAT Web App!
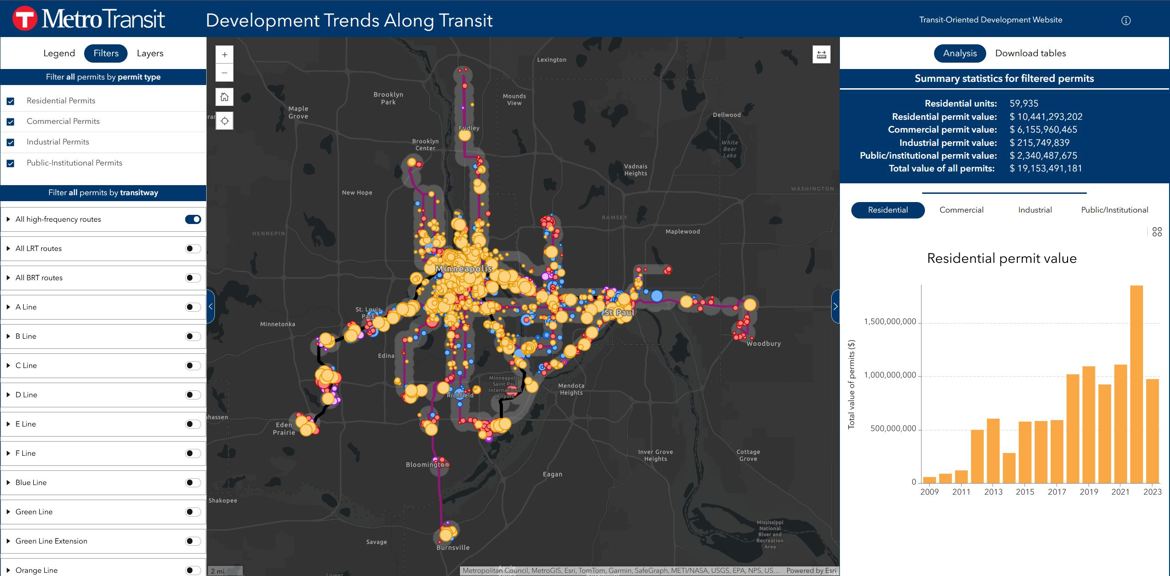
Now you can explore the core data of the Development Trends Along Transit report on your own and in-depth. With the new DTAT Web App, users can view building permits near high frequency transit - filter by development type, transitway, transit mode, year, and more. The app also shows summary statistics that dynamically update based on the filters you choose. Users can even export a list of permit entries based on their filters, including the data fields necessary to sort by transitway. The web app will be updated annually along with the Development Trends Along Transit report, and currently represents trends between 2009 and 2024.
Dig into the report that showed that $21.7 billion in development has been permitted along high frequency transit between 2009 and 2024, including:
44% of the region’s multifamily development by permit value
69,000 multifamily units
44% of the region’s commercial development
36% of the region’s public and institutional development
5% of the region’s industrial development