2027 Concept Plan Results
The Network Now concept plan calls for frequency and/or span-of-service improvements on most local routes, while commuter express service will be consolidated to offer frequent service in major travel corridors on key routes.
The proposed Concept Plan includes:
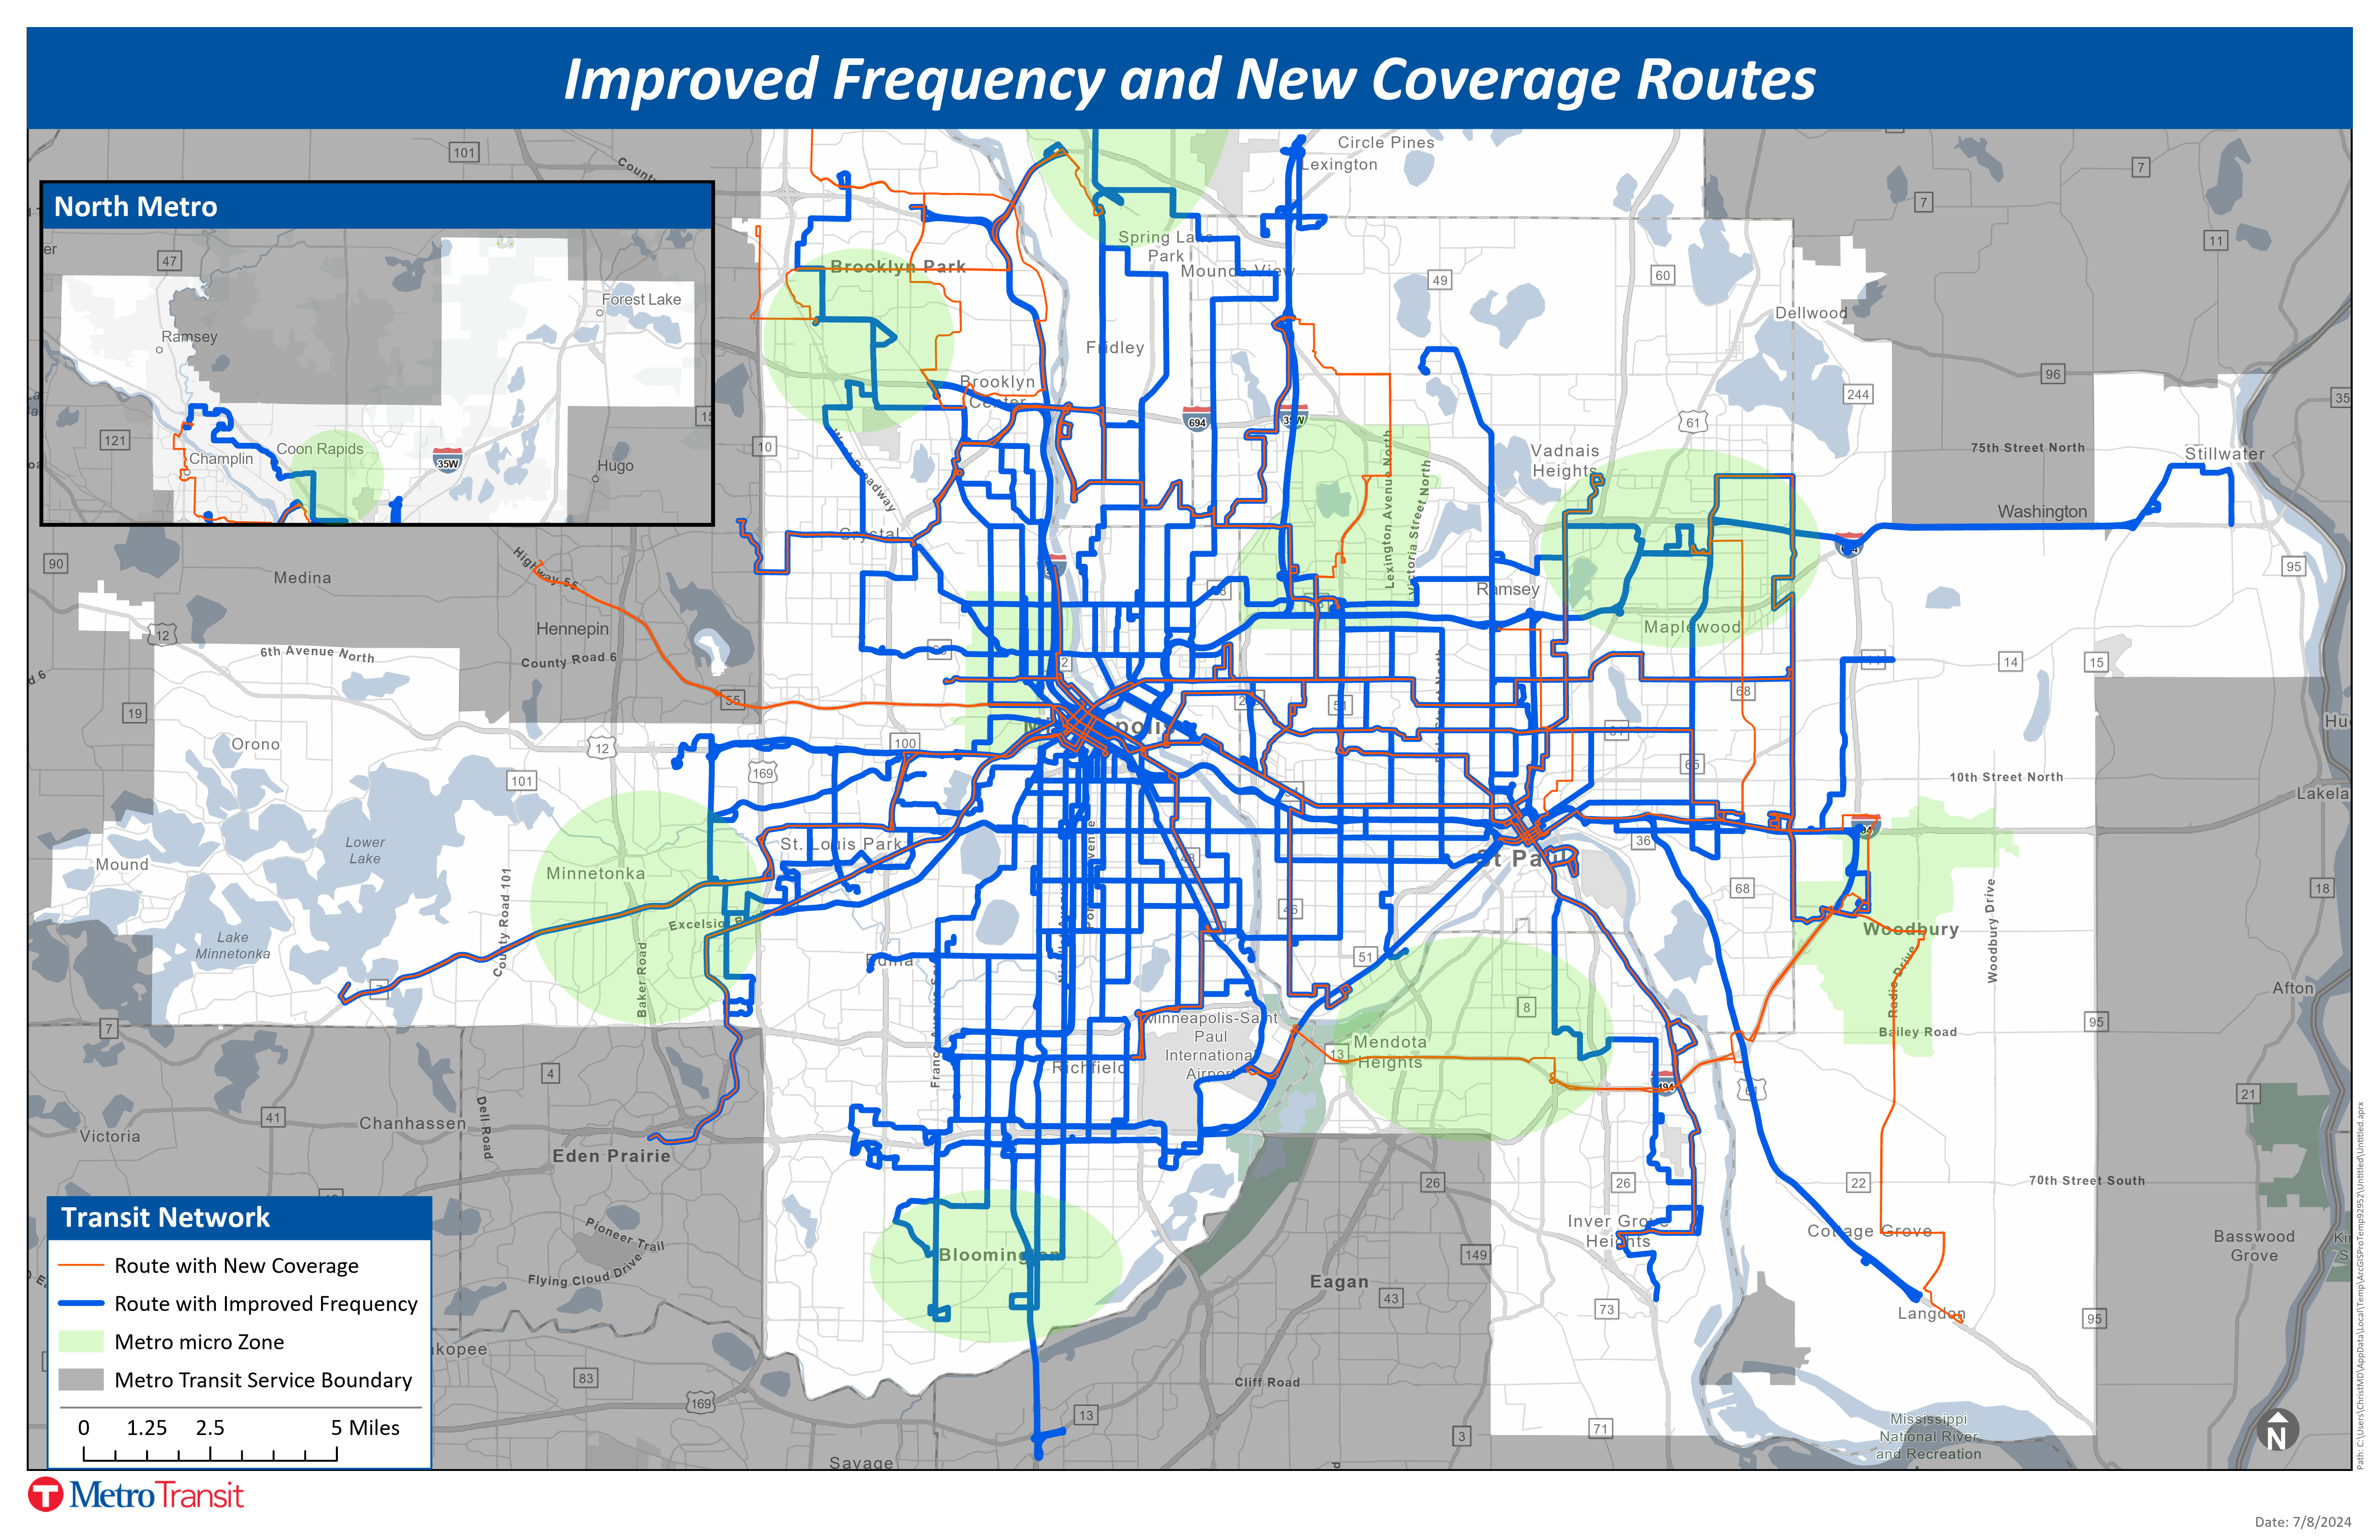
- Improved frequency and span of service on more than 60 routes
- 15 routes improved to operate every 15 minutes or better
- Light rail operating at a 10-minute frequency
- 8 new micro zones
- More than 20 routes with new areas of coverage
- A 25% increase in jobs reachable within 45 minutes for the average resident
Plan Overview
METRO Network
Frequency of Service
Commuter and Express Routes
Microtransit
Discontinued service
Plan Overview

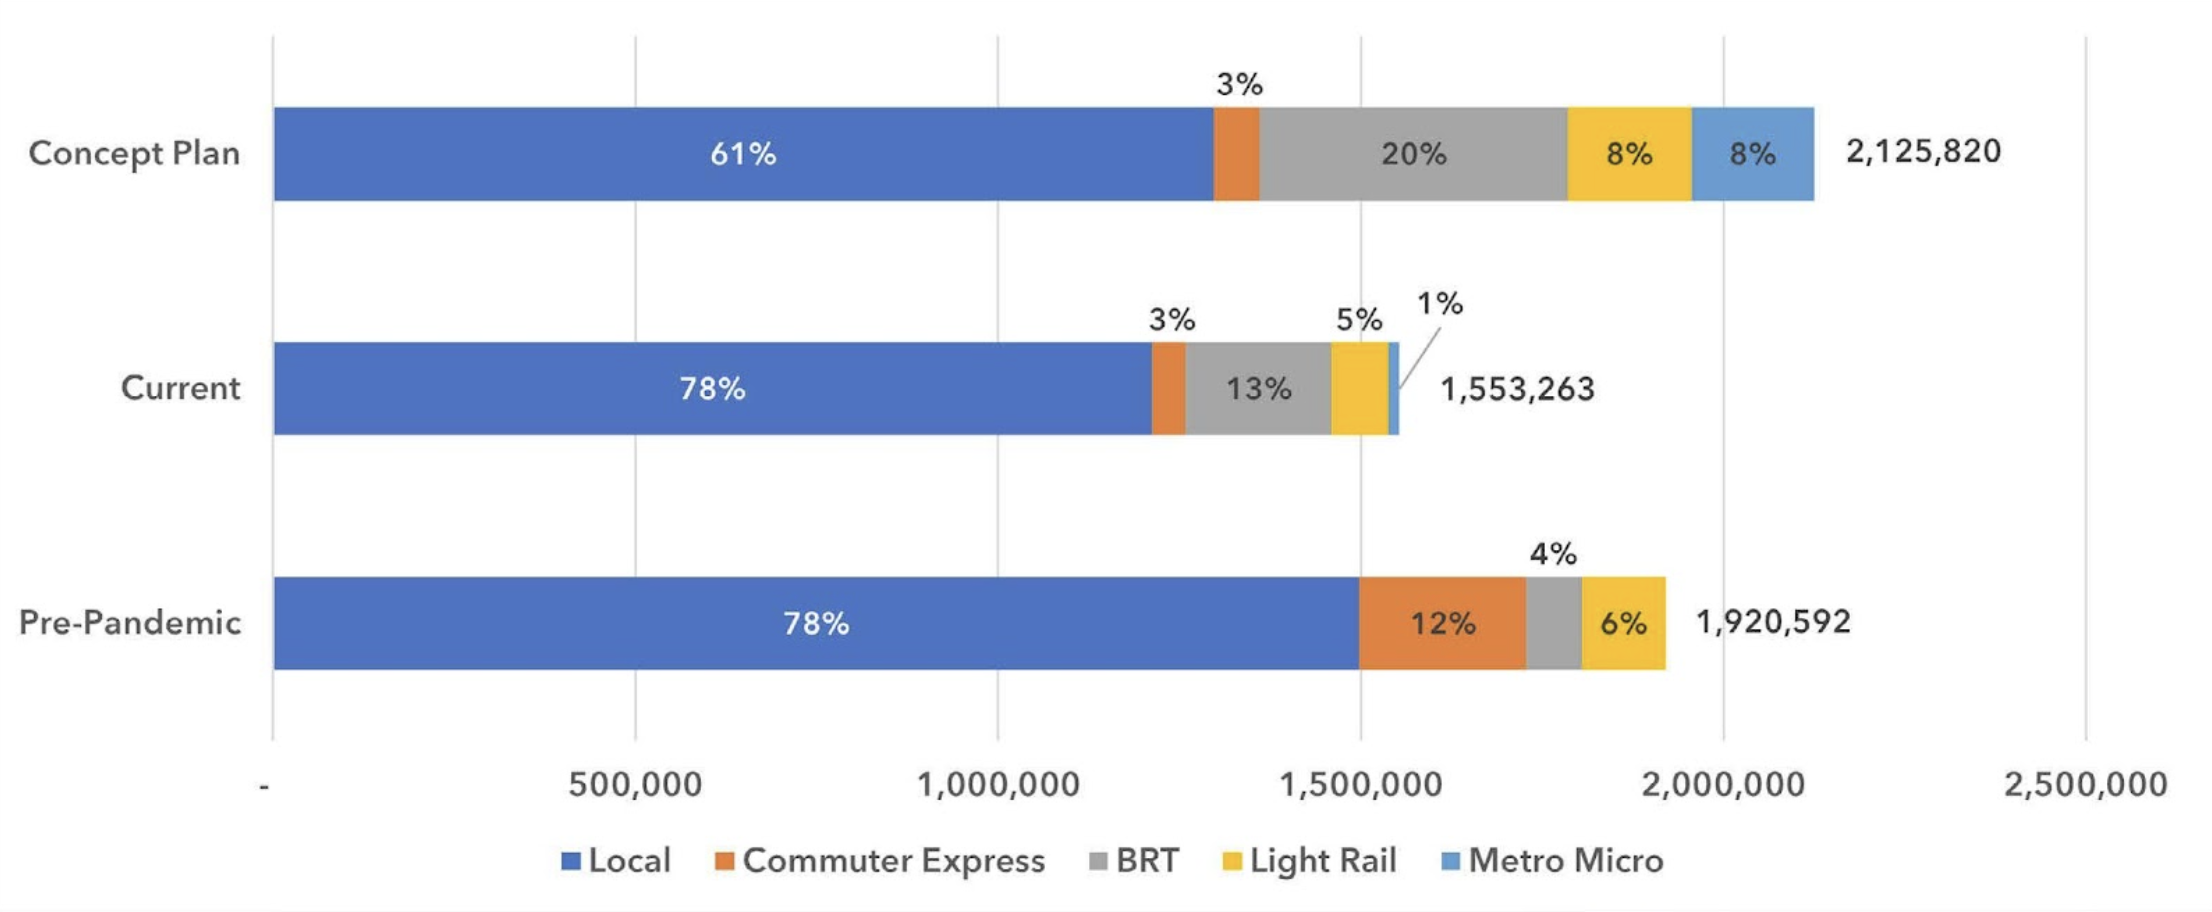
Percentage of annual in-service hours by service type
(Current as of December 2023, Pre-pandemic as of December 2019).
The proposed plan doubles investment in METRO Lines (bus rapid transit and light rail), is nine times the investment in Metro micro, and overall provides 35% more service than 2023.
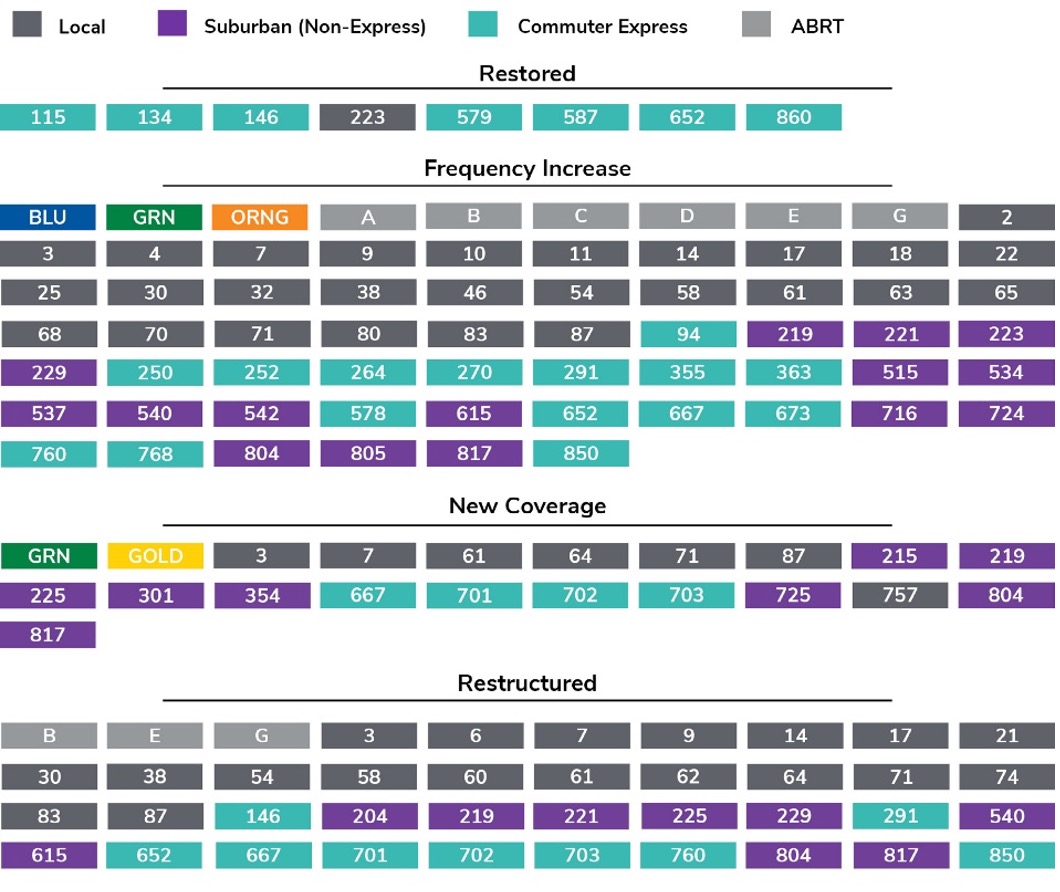
Types of changes by route
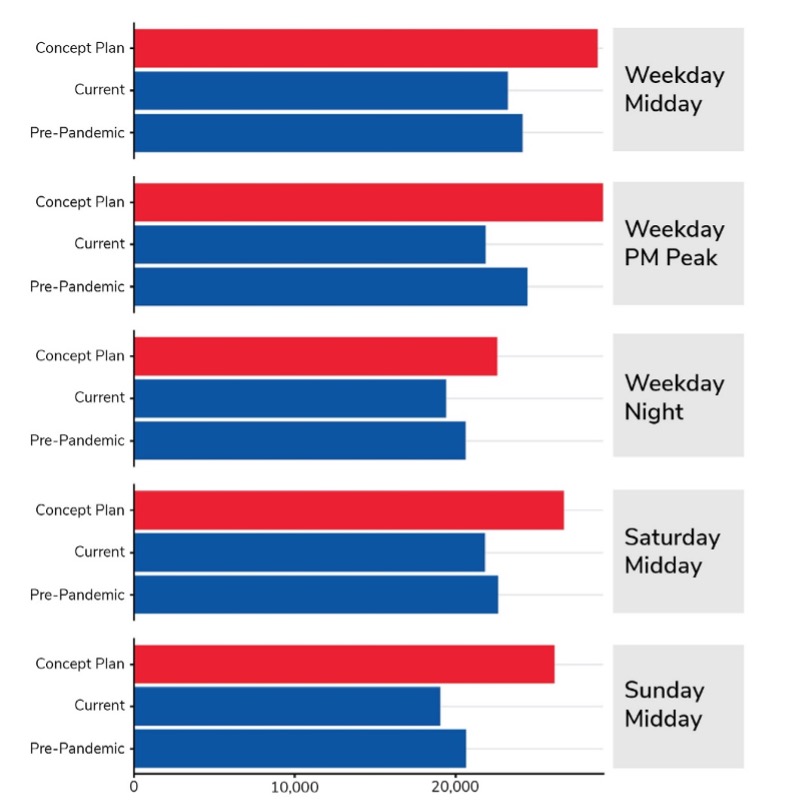
Job access by time of day
The concept plan provides access to more jobs and areas, recognizing many job types have hours outside standard office hours, and workers need access at more times of day and more days of the week relative to pre-pandemic service.
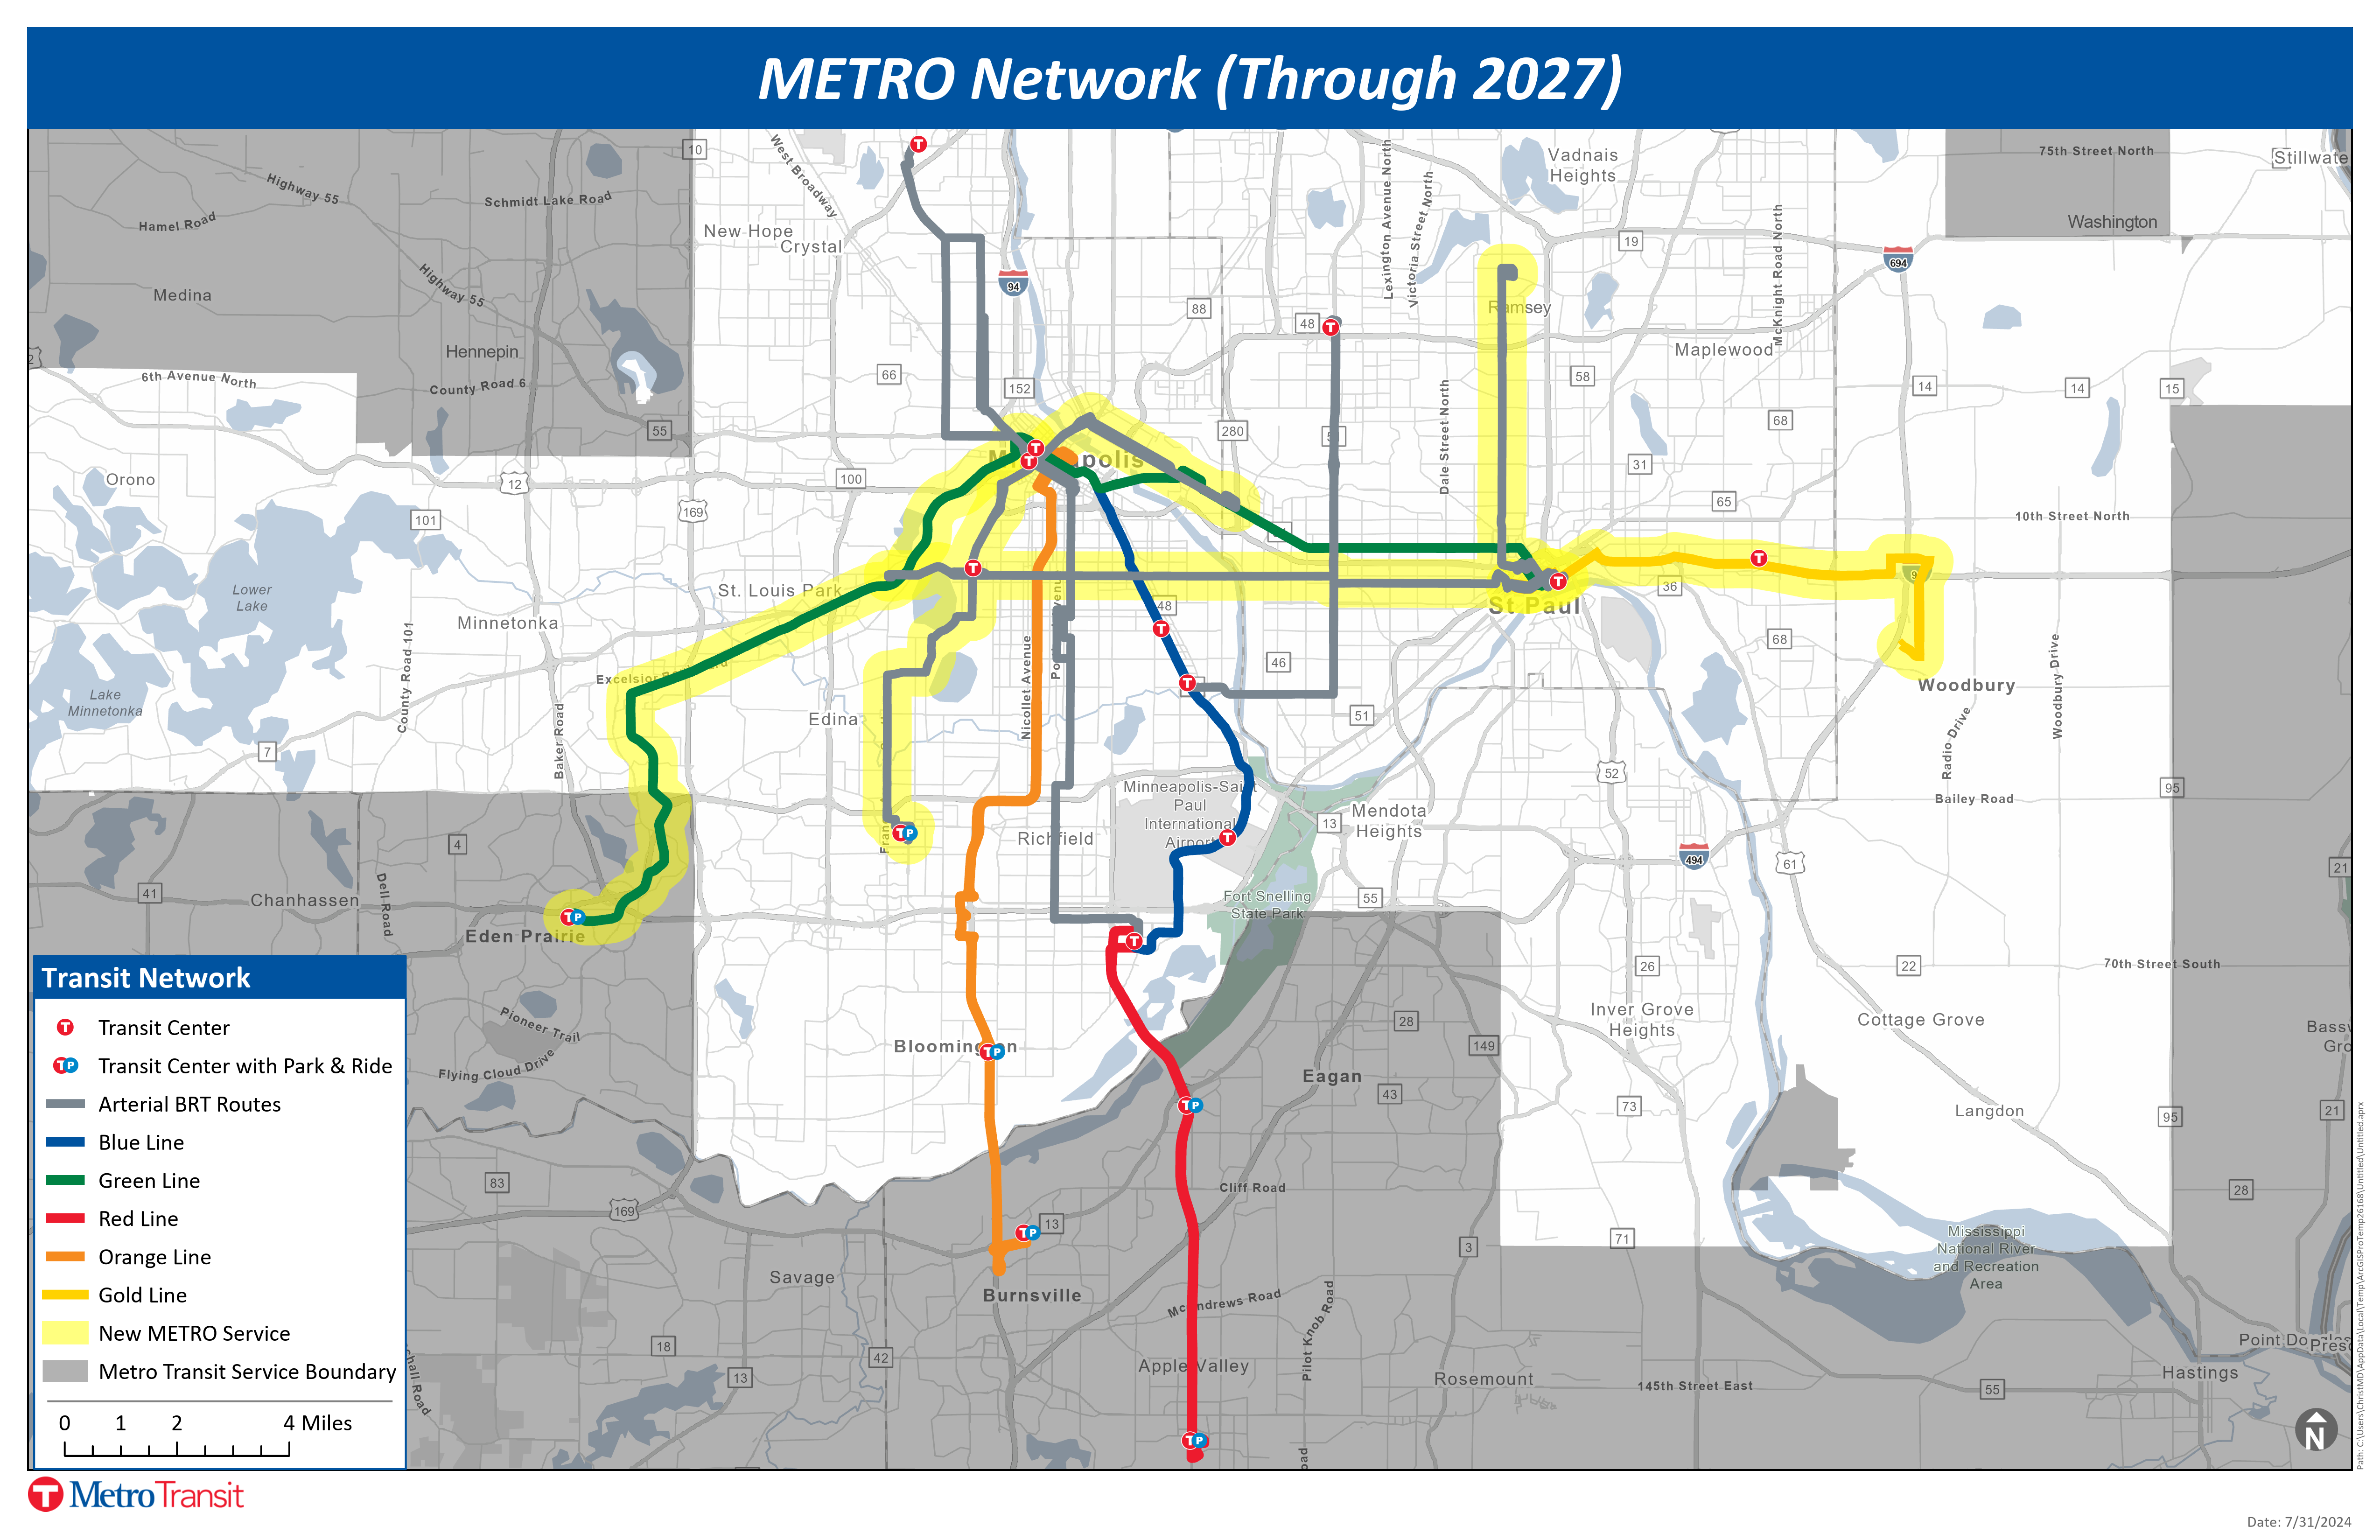
METRO Network
The METRO network, which includes arterial BRT, highway BRT, guideway BRT, and light rail transitways, represents a significant portion of Metro Transit’s planned investment in regional transit service. The Network Now concept plan includes frequency and span-of-service improvements on existing transitways, as well as the implementation of four new BRT transitways and extension of one light rail corridor by 2027.
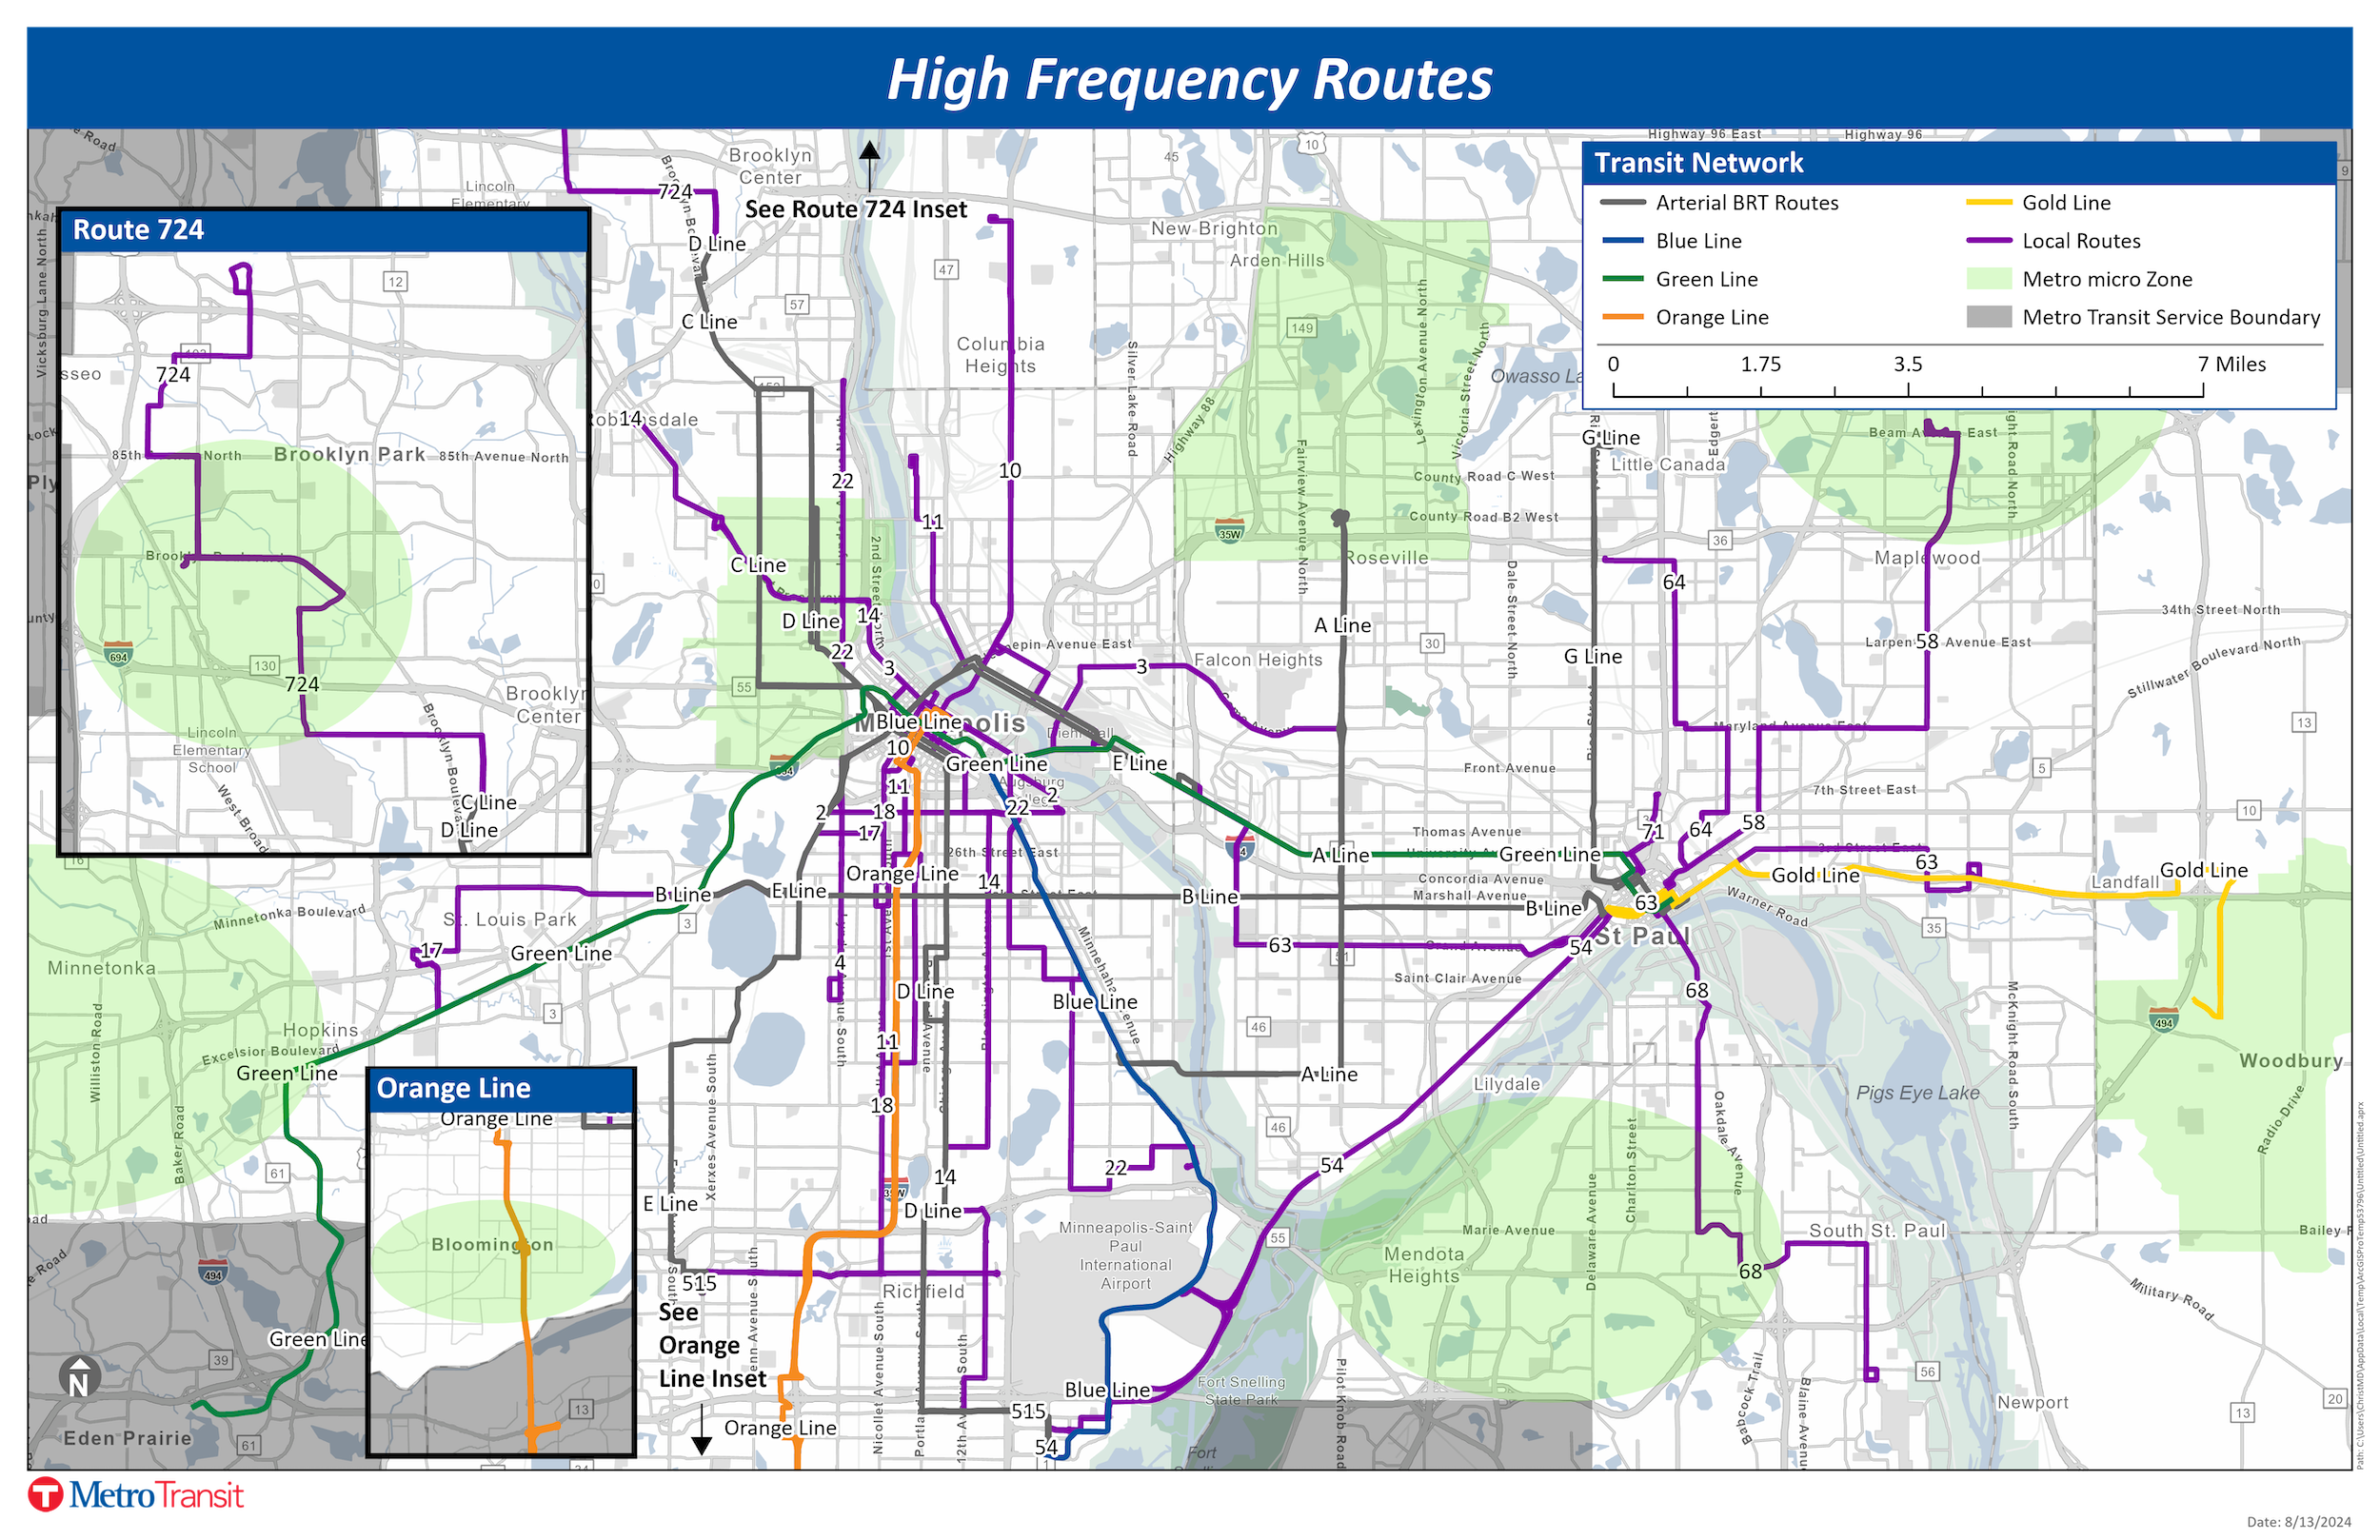
Frequency of Service
Network Now expands the number of routes with high frequent service to better connect customers to key destinations. New high frequency service will be available on Gold Line, Green Line Extension, B Line, E Line, G Line, and routes 4, 14, 17, 22, 58, 64, 68, 515 and 724.
Summary of weekday midday frequency
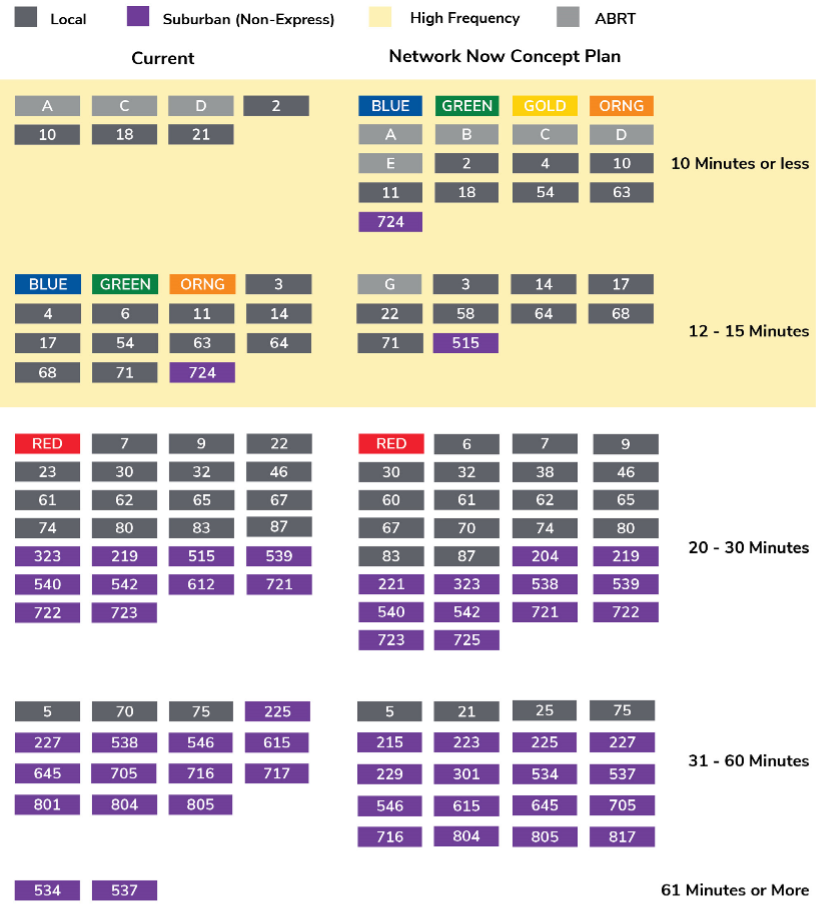
The Network Now Concept Plan focuses on redistributing service to offer frequent service throughout the region to continue growing ridership. Most of the service discontinued (shown in red) has not operated in at least two years. There are limited areas where service runs currently that will see discontinued service compared to December 2023 (shown in orange). Frequency for each route is shown at the route level, so certain segments or branches may offer fewer trips.

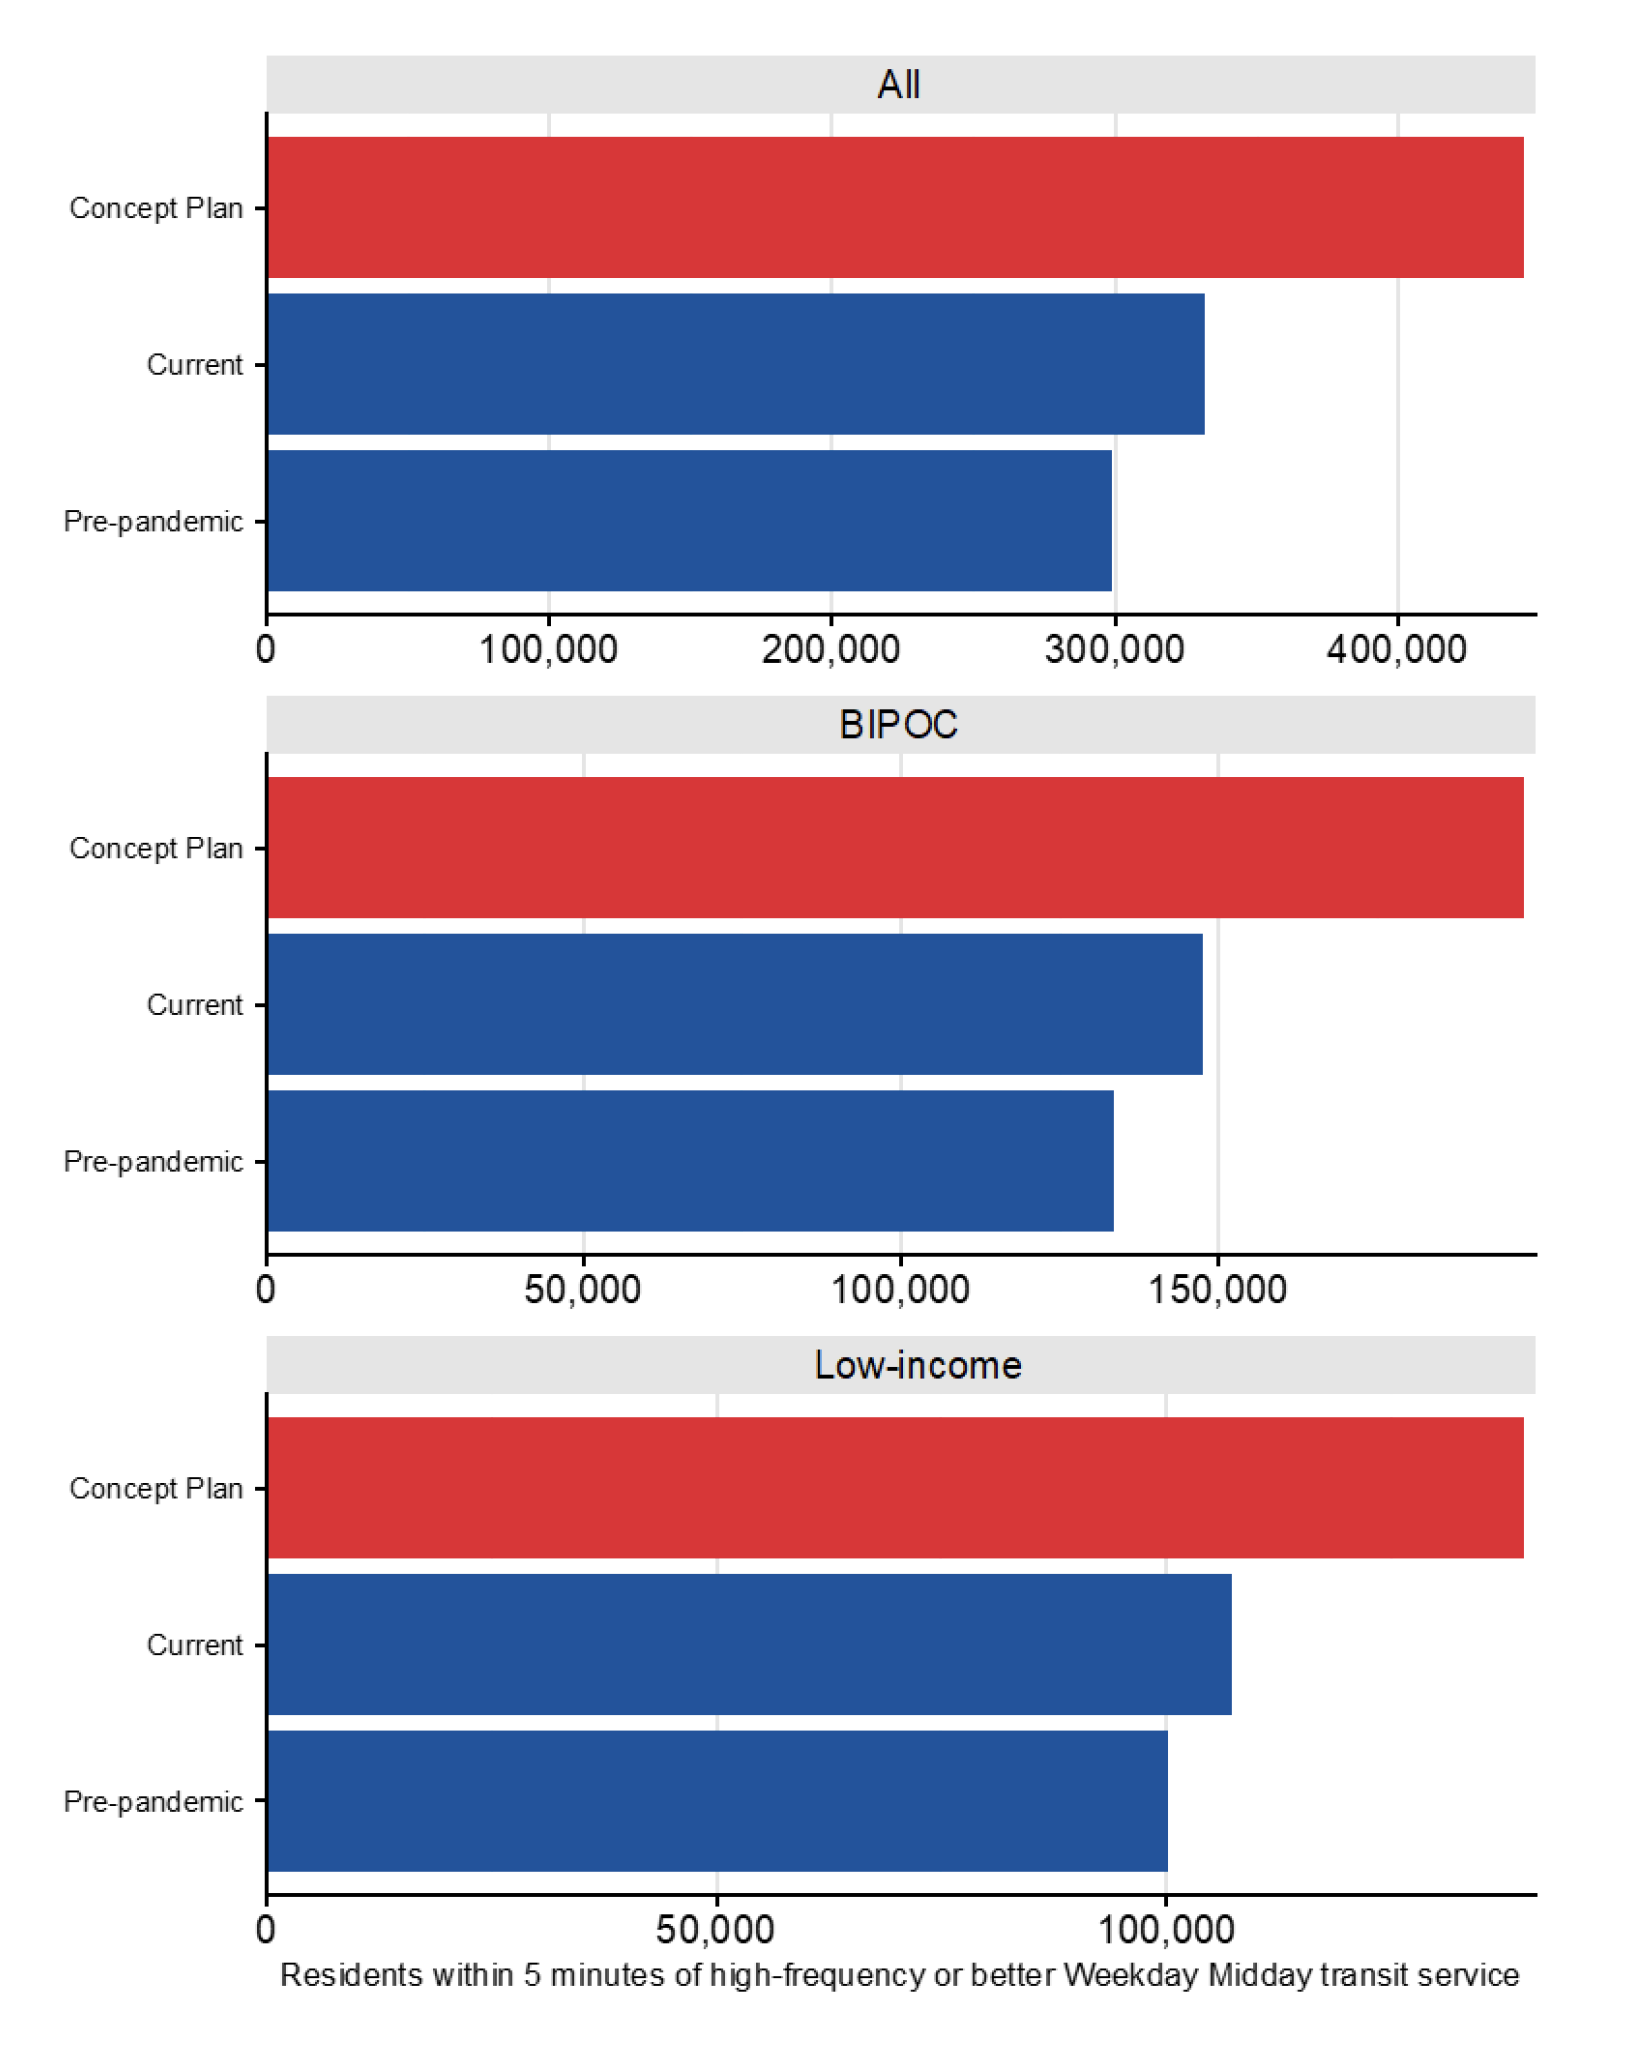
Access to high frequency service by race, income
Commuter and Express Routes
The Key Express Network provides all-day service and will include routes 94, 250, 270, 355, 673, 768, and 850, shown in purple. Customers who travel to a Park & Ride served by a Key Express Network routes will be offered service every 15 minutes or better during rush hour and also have midday service. Other changes to commuter-oriented routes include:
- Increase in service to the University of Minnesota
- Restoration of service on seven routes that are currently suspended: Routes 115, 134, 146, 579, 587, 652, and 860
- Maintain or improve levels of service on existing commuter express routes
- Offer robust service on BRT and light rail with Park & Ride access
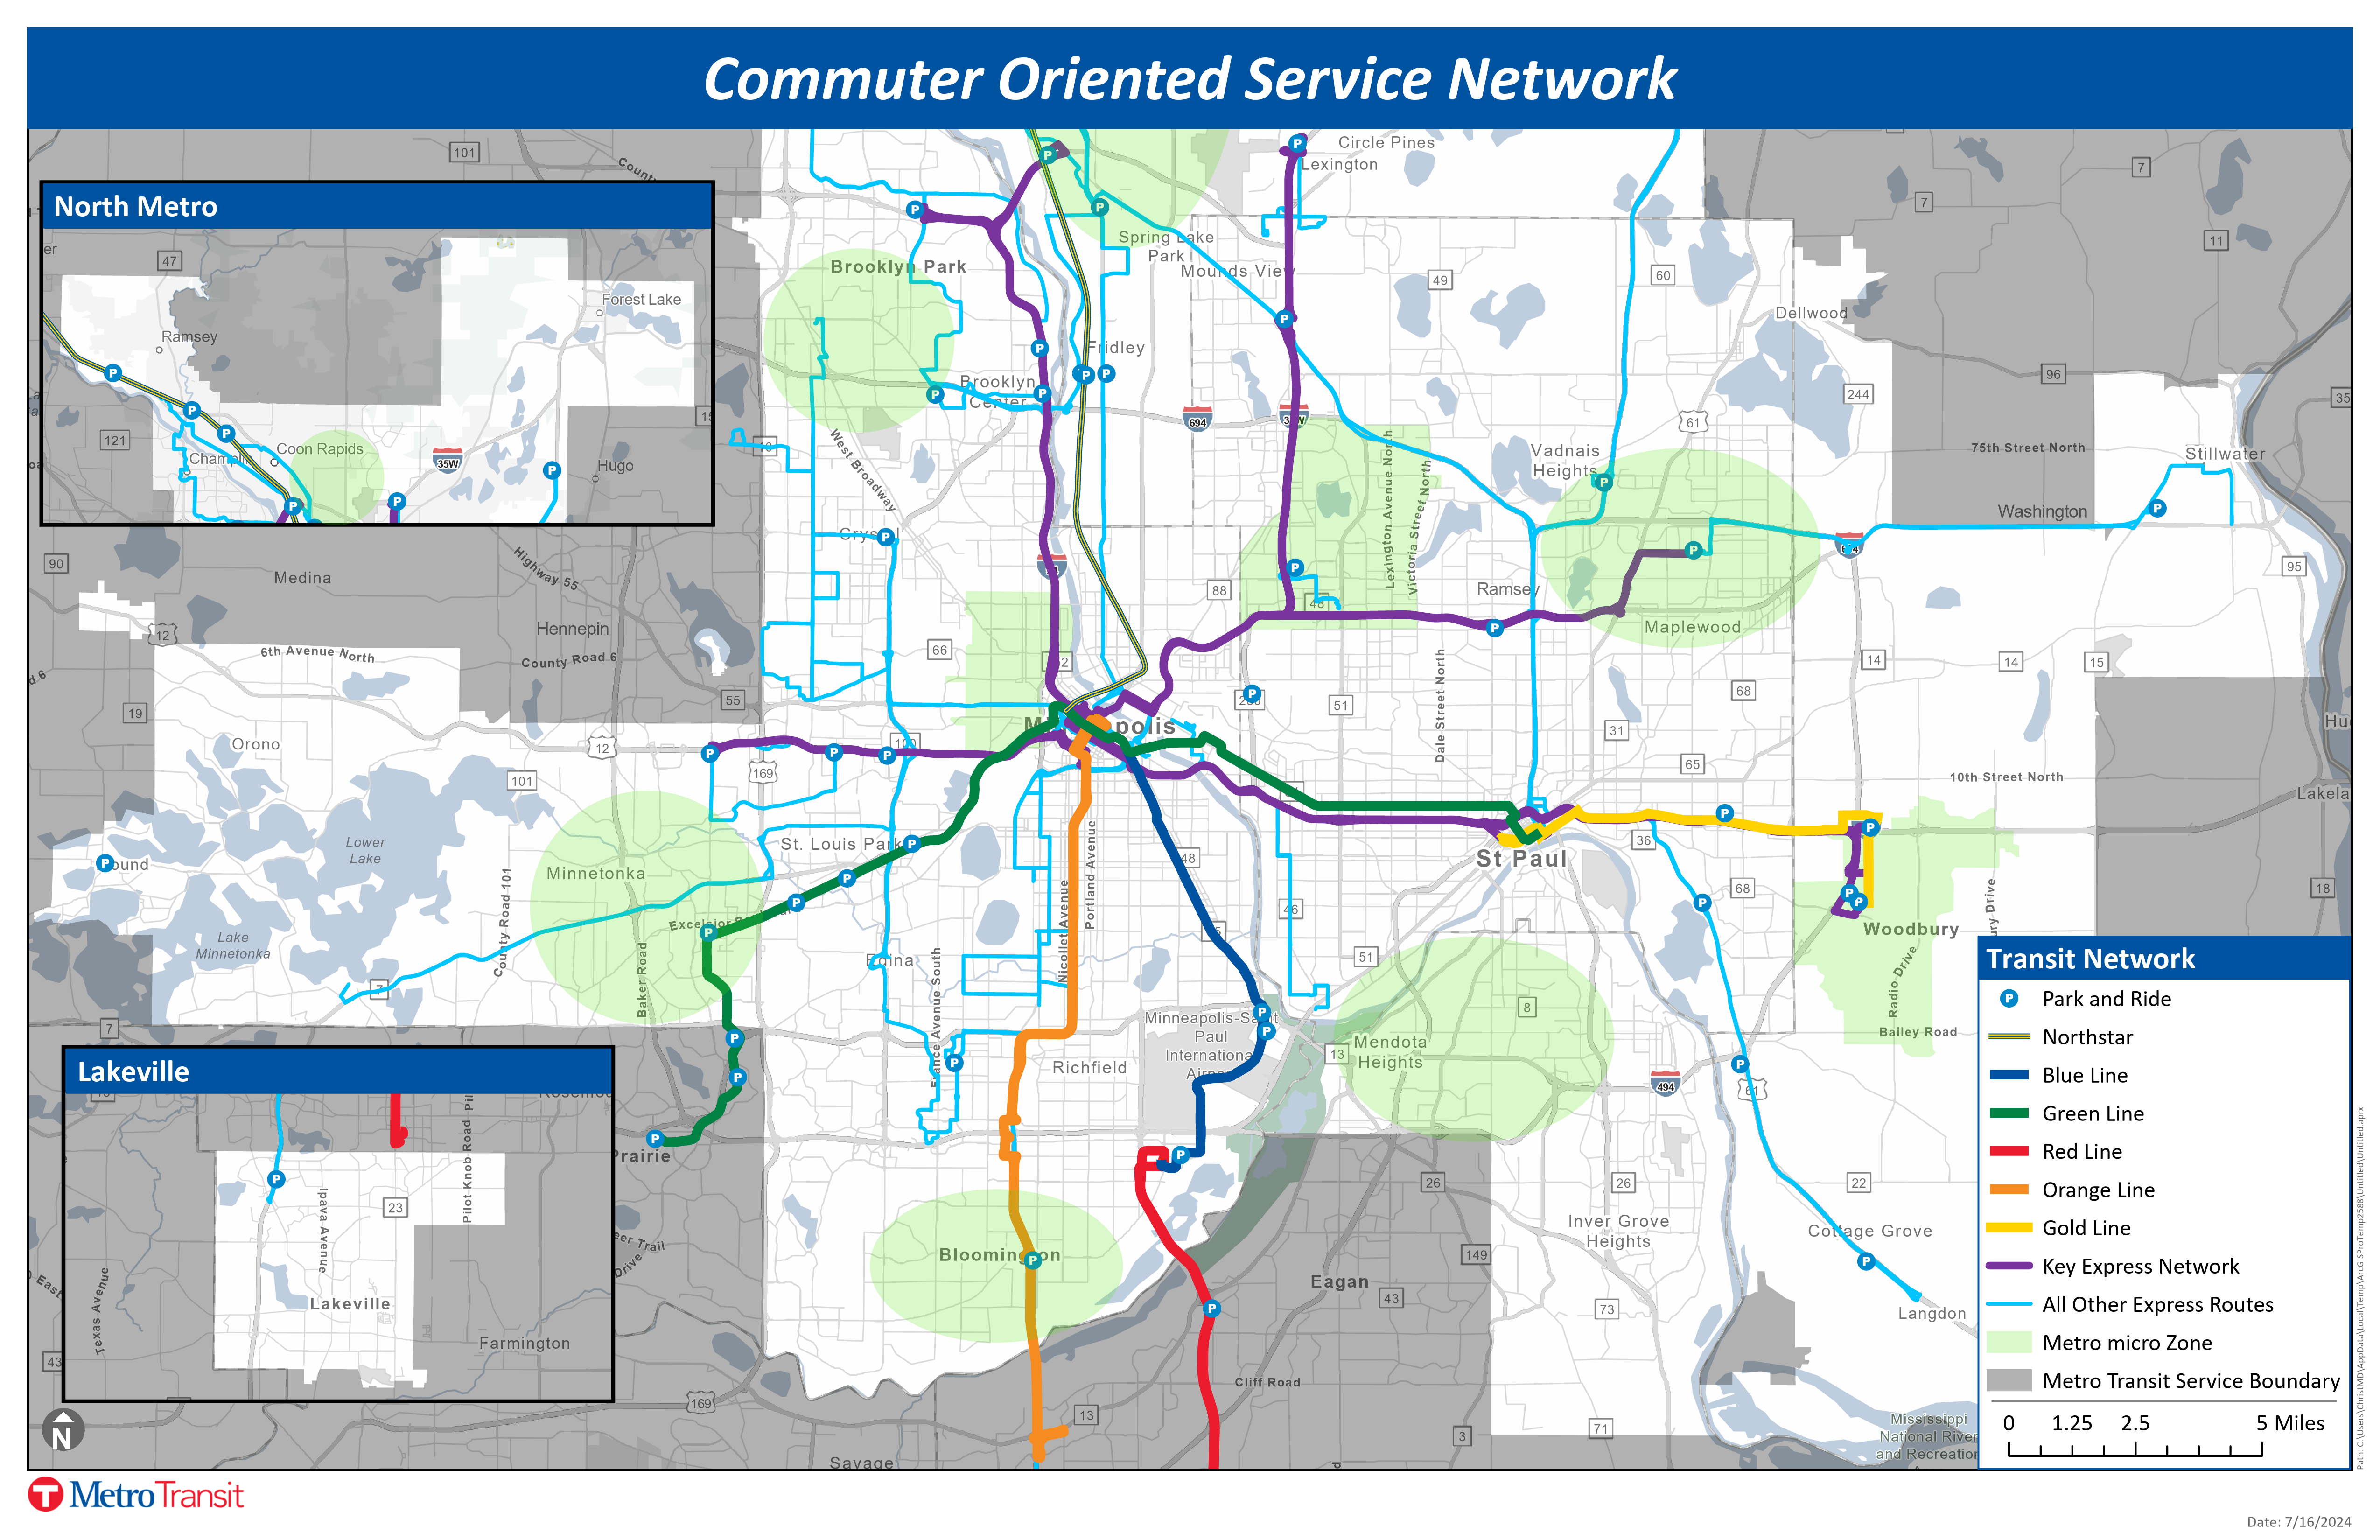
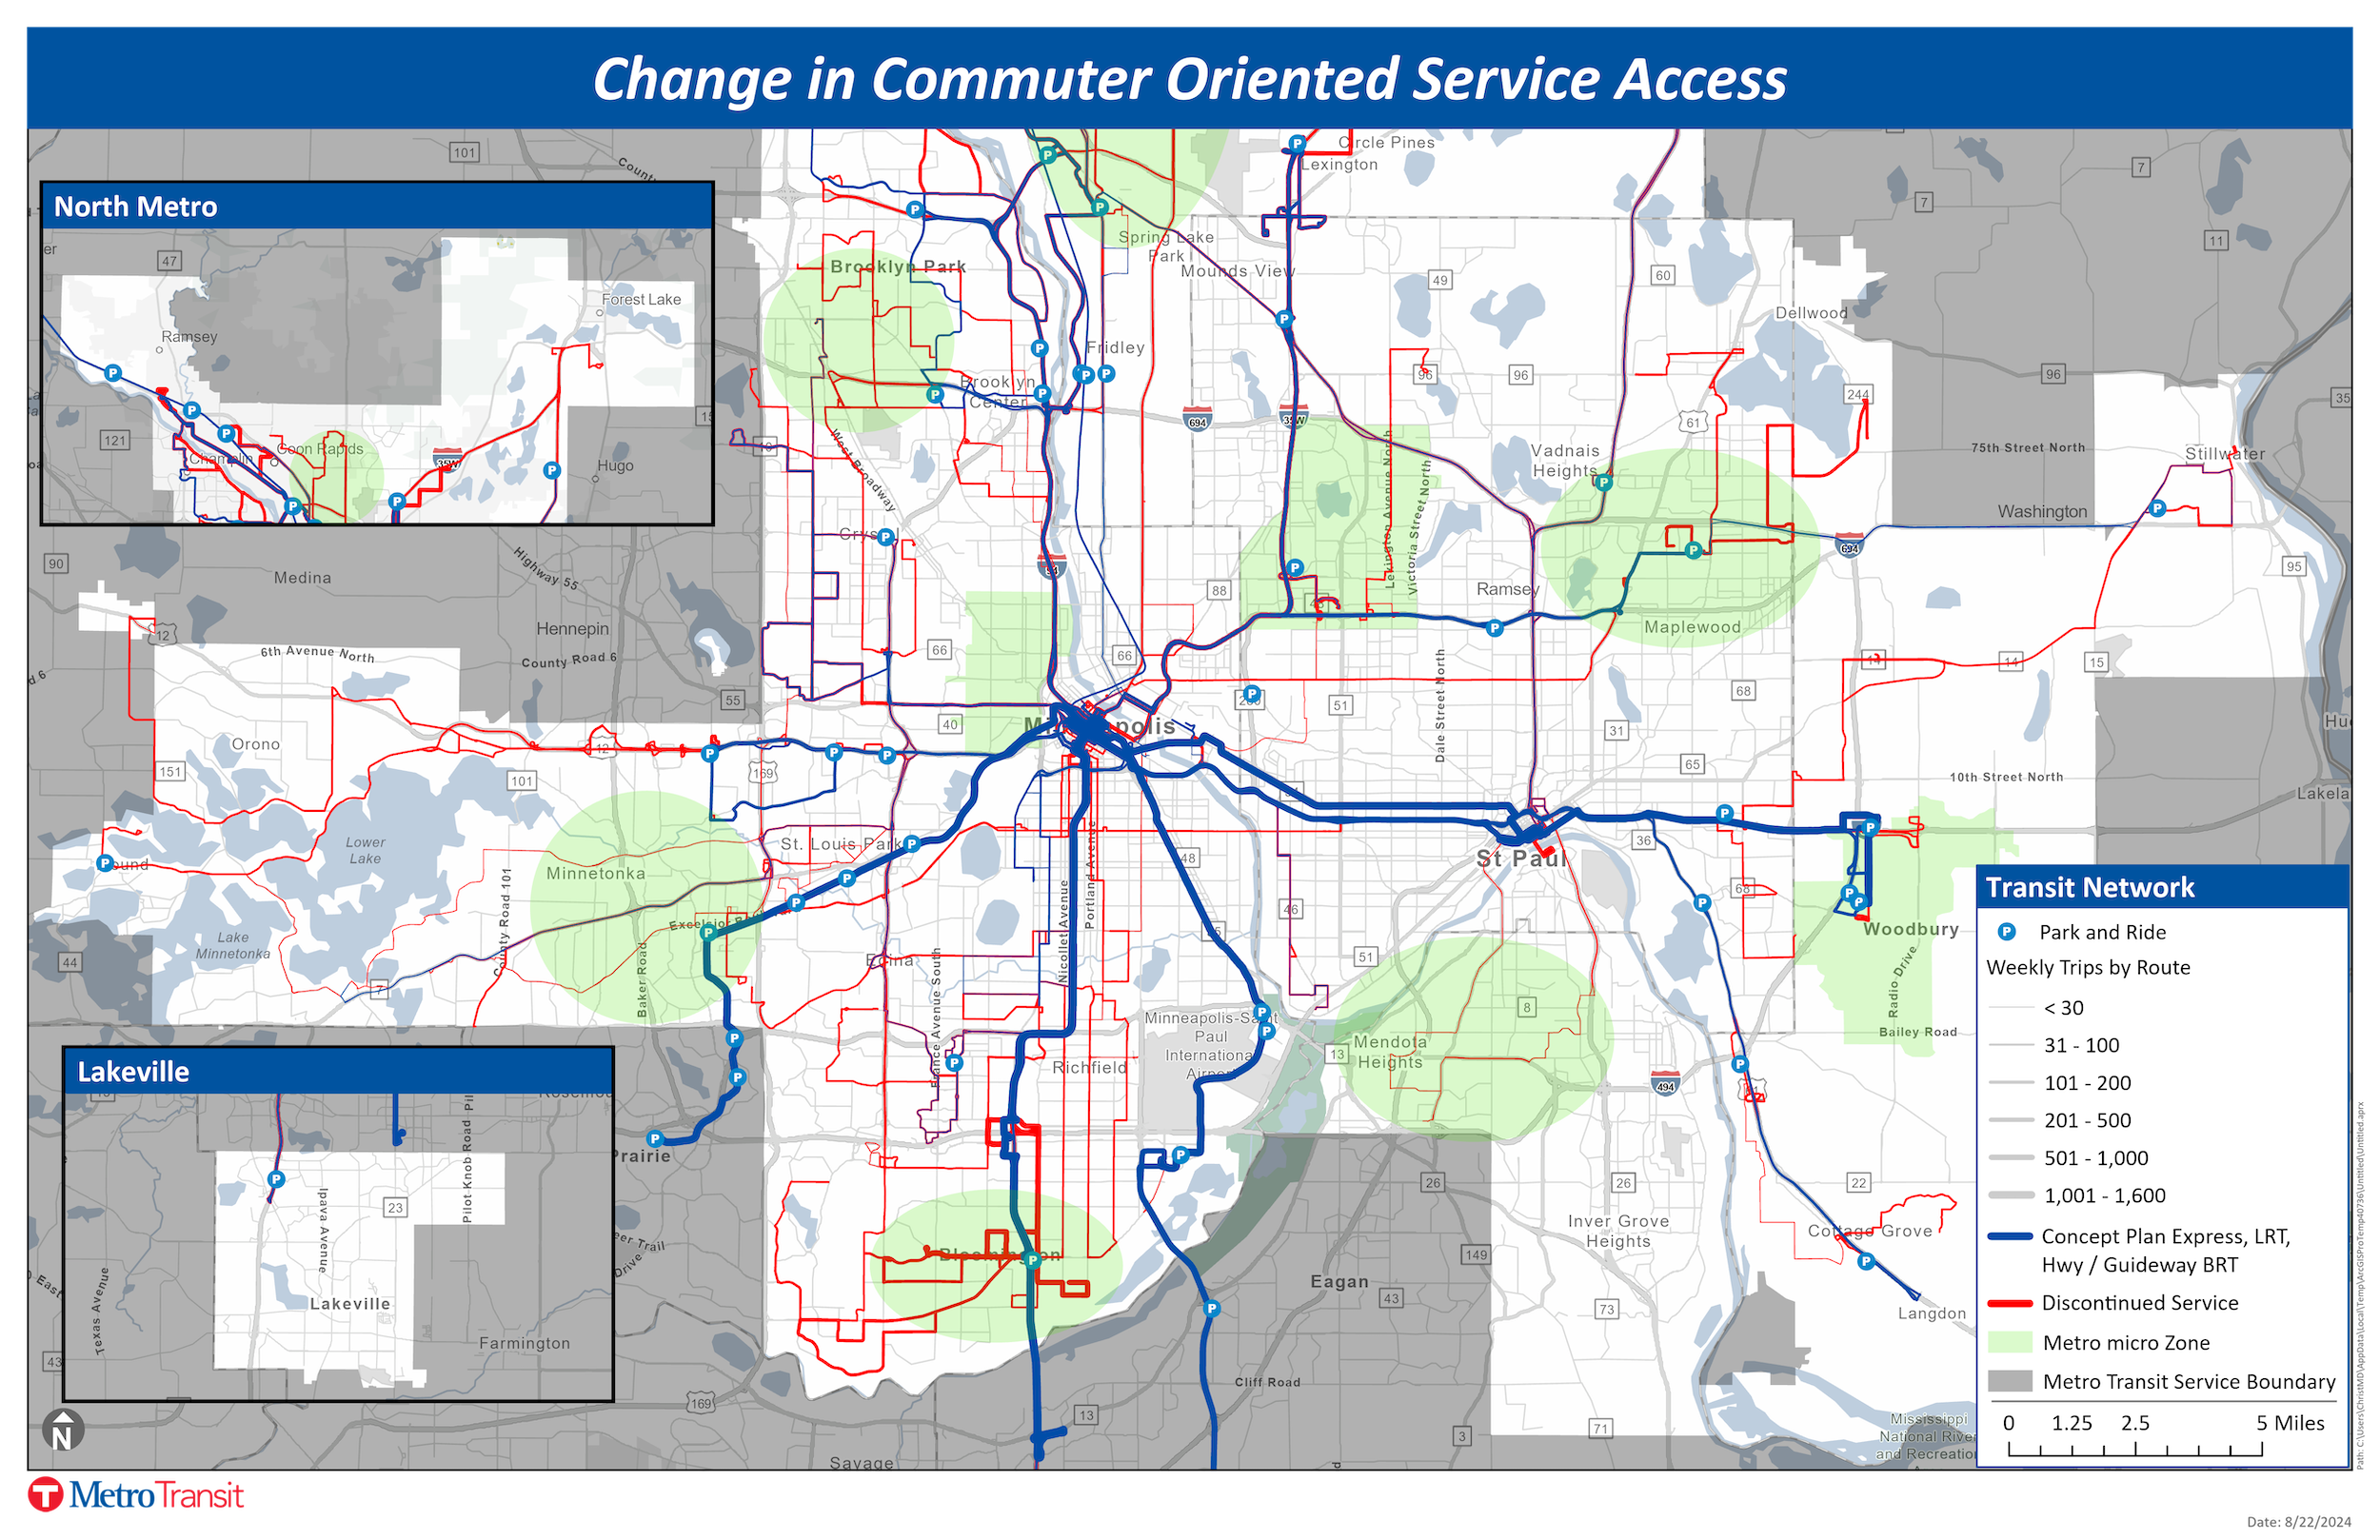
Through 2027, Metro Transit will increase service on commuter-oriented routes by more than 50% compared to current levels, which will allow for more frequent and reliable trips. Proposed commuter-oriented service in the concept plan, including regular bus service, bus rapid transit, commuter rail, and light rail is shown below. The plan primarily focuses on restoring suspended service, network expansion, and improved connectivity, but it also proposes the discontinuation of some service, primarily on commuter express routes with few trips that have not operated for several years. In the map below, the number of weekly trips offered on a route proposed to be discontinued, which are shown in red, reflects the level of service before it was suspended.
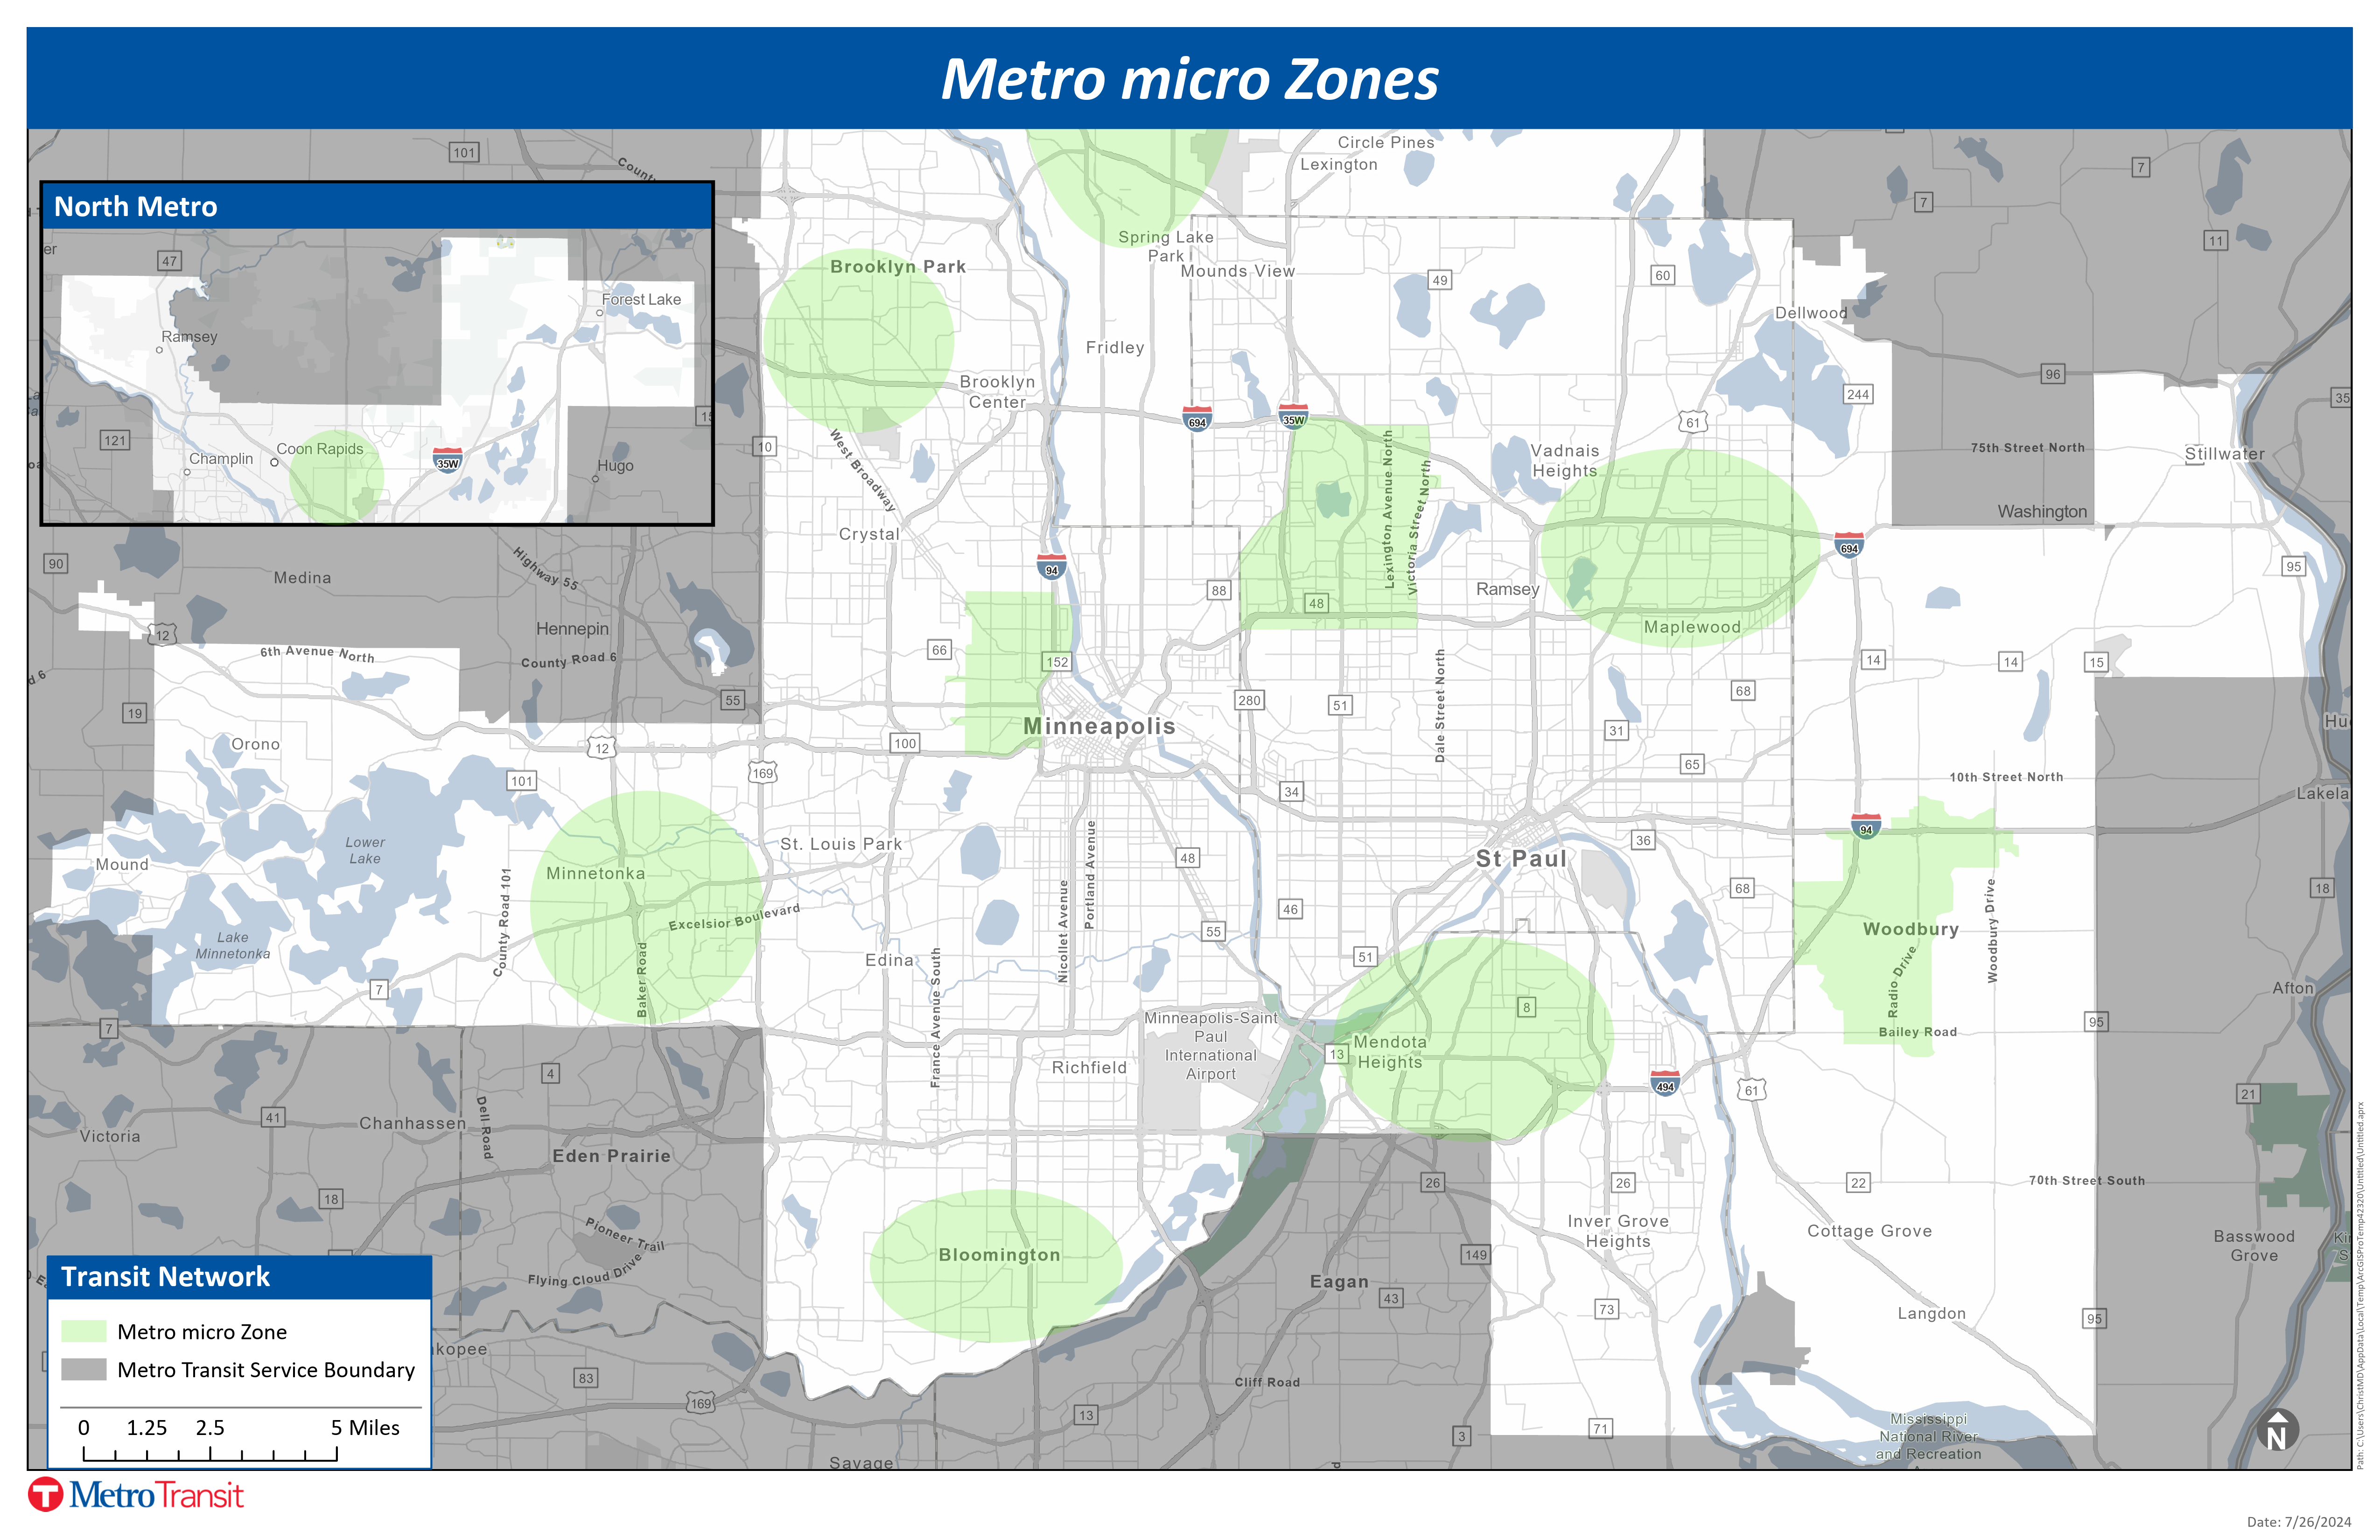
Microtransit
Metro micro is the Met Council’s shared ride, curb-to-curb microtransit service allowing customers to be picked up and dropped off at any location within a designated service area. The program initially began as a 24-month pilot within a single North Minneapolis Area zone, which will become permanent in October 2024. Expansion zones are planned to be piloted as part of a phased process, with a goal of up to two new zones implemented each year through 2027. Two new zones will be launched in January 2025: the Rosedale Area and Woodbury Area zones.
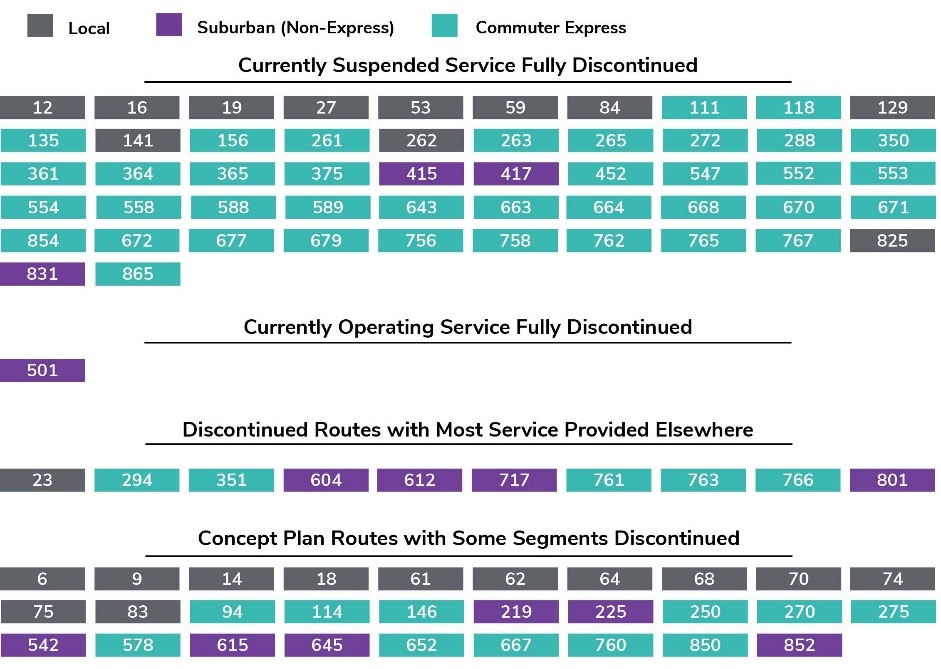
Discontinued Services
Transit suspended service on 63 bus routes and segments of 18 other routes, many starting in 2020. The Network Now concept plan includes restoration of a limited number of bus routes and discontinuation of others. Route restoration is considered based on performance and public input, as well as service design and the presence of alternatives.