It was another record-setting year for Metro Transit’s light rail and Bus Rapid Transit lines.
The Green Line, Blue Line and A Line each saw their highest annual ridership ever in 2018, breaking records that were set just a year earlier.
Ridership on the Green Line has steadily risen since the light rail line opened in 2014. Nearly 13.8 million rides were taken on the Green Line last year. Average weekday ridership topped 42,500 rides.
More than 11.1 million rides were taken on the Blue Line, the highest annual total since it opened in 2004. The increase in Blue Line ridership partly reflects a shift to transit amid construction on Interstate 35W.
In its second full year of service, customers took more than 1.6 million rides on the A Line. Total ridership in the A Line corridor is about one-third higher than 2015, when it was served only by Route 84.
“Continued growth in light rail and Bus Rapid Transit ridership affirms what we’ve always believed – that people value fast, frequent and reliable service,” Metro Transit General Manager Wes Kooistra said. “We are encouraged by the response and look forward to offering more of this service in the years to come.”
System-wide, Metro Transit provided more than 80.7 million total rides in 2018. This was the eighth consecutive year annual ridership topped 80 million rides, keeping ridership at its highest point in three decades.
Across transit types and providers, nearly 94.2 million rides were provided in the seven-county region in 2018. That total includes suburban transit providers as well as the Metropolitan Council’s Metro Mobility, Transit Link and Vanpool services.
Metro Transit’s 2018 ridership total includes 55 million local and express bus rides (including Maple Grove Transit, which is operated under contract by Metro Transit). Bus ridership declined 4 percent from 2017.
Some ridership loss was expected following an October 2017 fare increase. Lower-than-usual gas prices also played a role.
The decline in bus ridership largely reflects losses on Metro Transit’s busiest local routes, which will be substantially replaced and improved with Bus Rapid Transit service in the coming years.
Where service improvements have been made, bus ridership has risen. Ridership to St. Louis Park’s West End and on routes 32 and 54 improved in 2018. Some Route 54 trips began offering limited stop service between downtown St. Paul and Maplewood Mall beginning in June 2018.
Other 2018 ridership highlights include:
> More than 1.3 million rides through the Transit Assistance Program, which allows qualified individuals to ride buses or light rail for $1.
> A record number of Vikings fans took transit to and from home games. In all, nearly 263,000 rides were provided to and from U.S. Bank Stadium over the course of the pre- and regular season.
> A record number of rides were provided to and from the Minnesota State Fair on Saturday, Sept. 1. More than 83,500 rides were provided on State Fair Express Buses and regular routes that serve the fairgrounds that day.
> Nearly 210,000 additional rides were taken over more than a week’s worth of Super Bowl events in February 2018.
Metro Transit 2018 Ridership At A Glance
| Mode |
Total Rides |
Average Weekday Rides |
Percent change from 2017 |
| Bus |
53.3 million |
177,319 |
- 4% |
| Green Line |
13.8 million (record) |
42,572 |
+ 5% |
| Blue Line |
11.1 million (record) |
32,921 |
+ 4% |
| A Line |
1.6 million (record) |
4,860 |
+ 2% |
| Northstar |
787,327 |
2,814 |
0 |
| Total |
80.7 million |
260,486 |
- 1% |
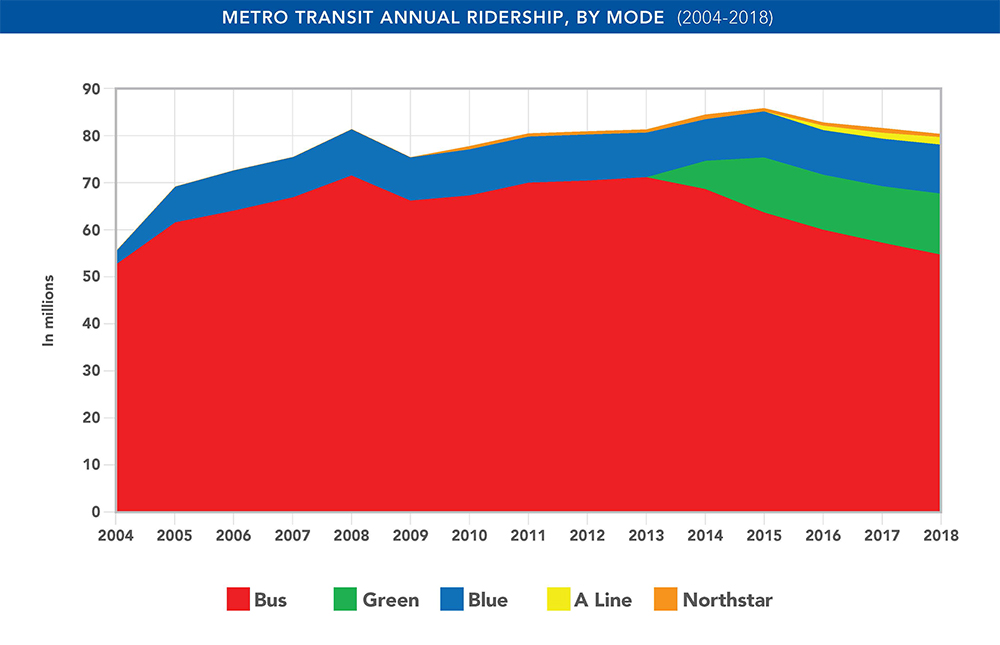
Metro Transit Annual Ridership, 2004-2018

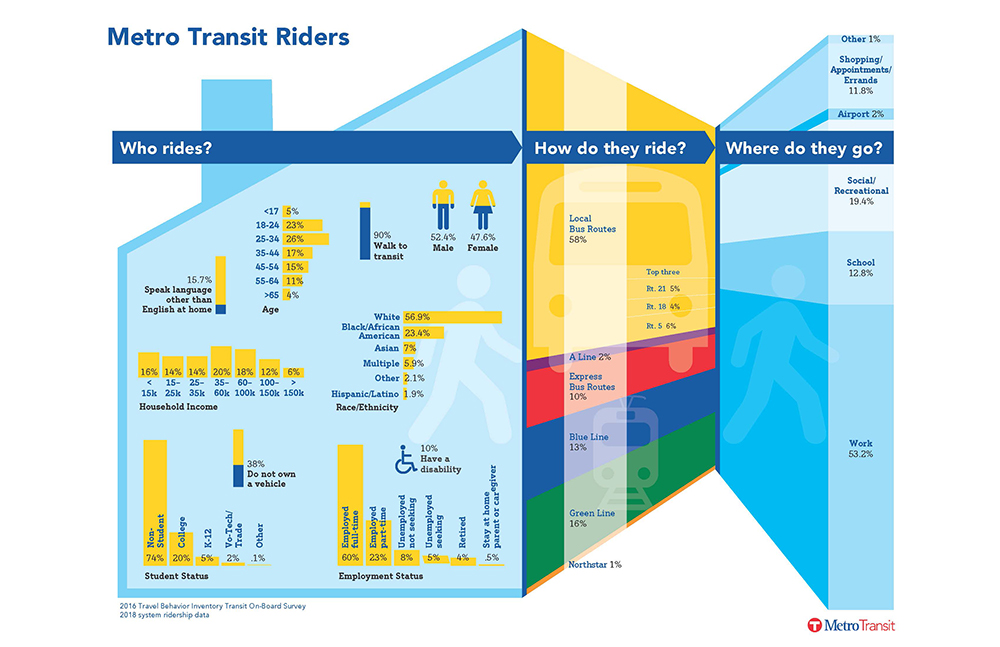
Who rides Metro Transit?