From Joey Reid, Senior Data Scientist
Transit Vitals
Although there are many reasons we operate transit, the health of a transit system is often measured in ridership. Even before the first COVID-19 cases were detected in Minnesota, I started to wonder—if I'm worried about catching this virus from other people, are the rest of our riders also worried? Are people already choosing not to ride out of concern for the pandemic?
I started to lookup official ridership numbers in a couple of our databases, but both sources were days or even weeks behind. Our ridership usually changes slowly, over months and years. But this was a pandemic—if anything could change ridership quickly, this was it. I needed a way to see what had happened yesterday, not a week ago.
Real-time Passenger Counts
We have an incredible system that tracks the locations of all our vehicles, how far ahead or behind schedule they might be and more. This system also allows us to track how many people get on and off the bus, and where this activity happens. We're very lucky that all our buses have infrared sensors that provide this data and can report ridership in real-time.
Of course, all methods of counting things have errors, and counting passengers is particularly hard. People board the bus with backpacks, strollers and luggage—all things that might confuse an automatic counter. There's a reason we don't usually use the initial data we get from these counters. Still, they are usually very accurate and there's a huge advantage to seeing how many people boarded a vehicle in the last minute, instead of waiting a week. 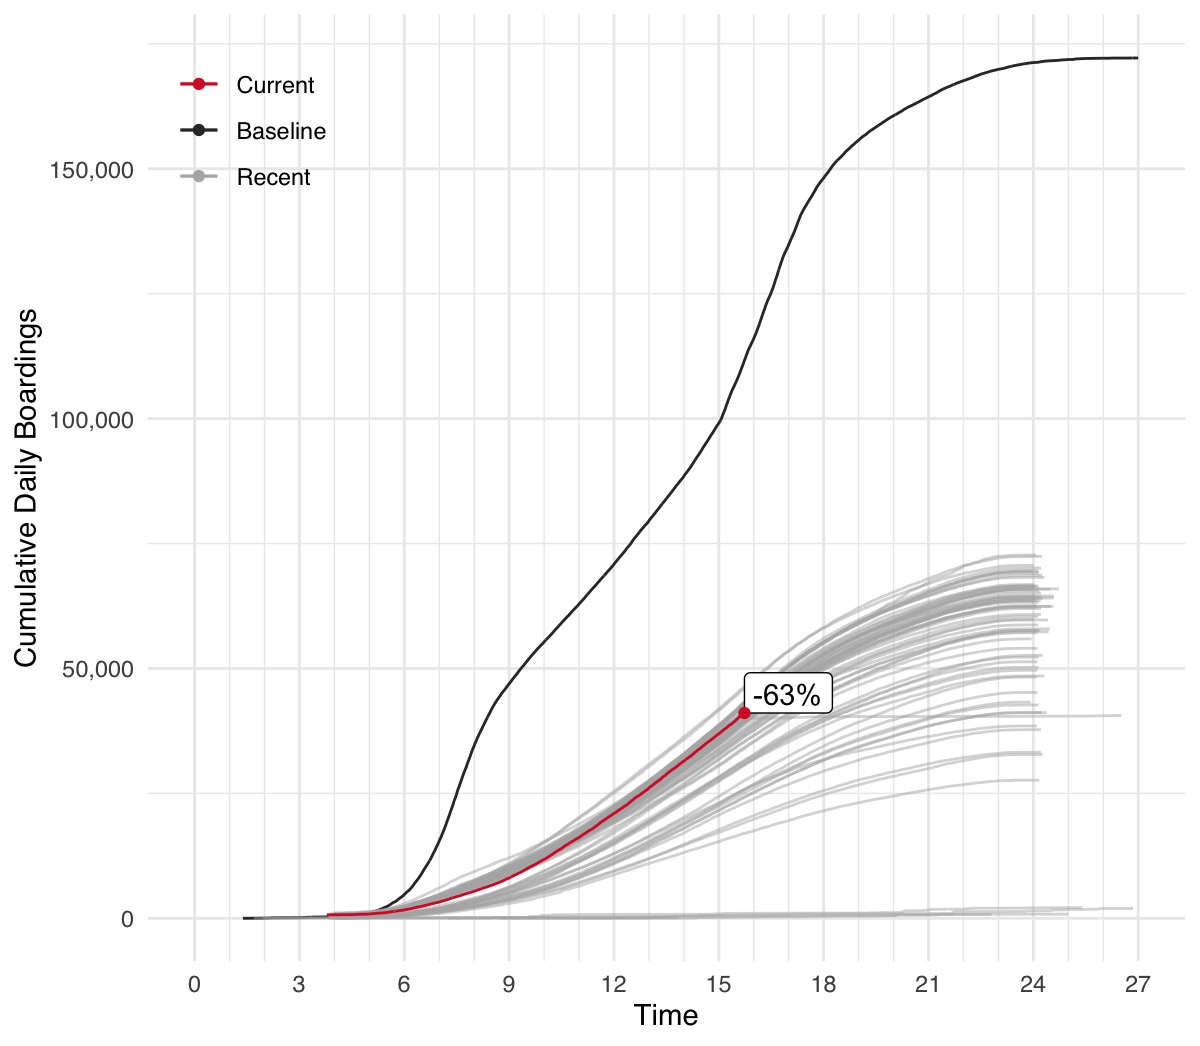
Figure 1: Up-to-the-minute monitoring of ridership on June 3, when service resumed after days of protests related to the killing of George Floyd.
Tracking Ridership Change
I quickly set up a new database to track passenger counts in near real-time. I used the last week of February as a reference for our typical ridership patterns. Now we could see the change in ridership every day, and group the rapidly changing ridership patterns by route, trip, time of day and something called a run. A run is a series of trips run by the same driver on the same bus.
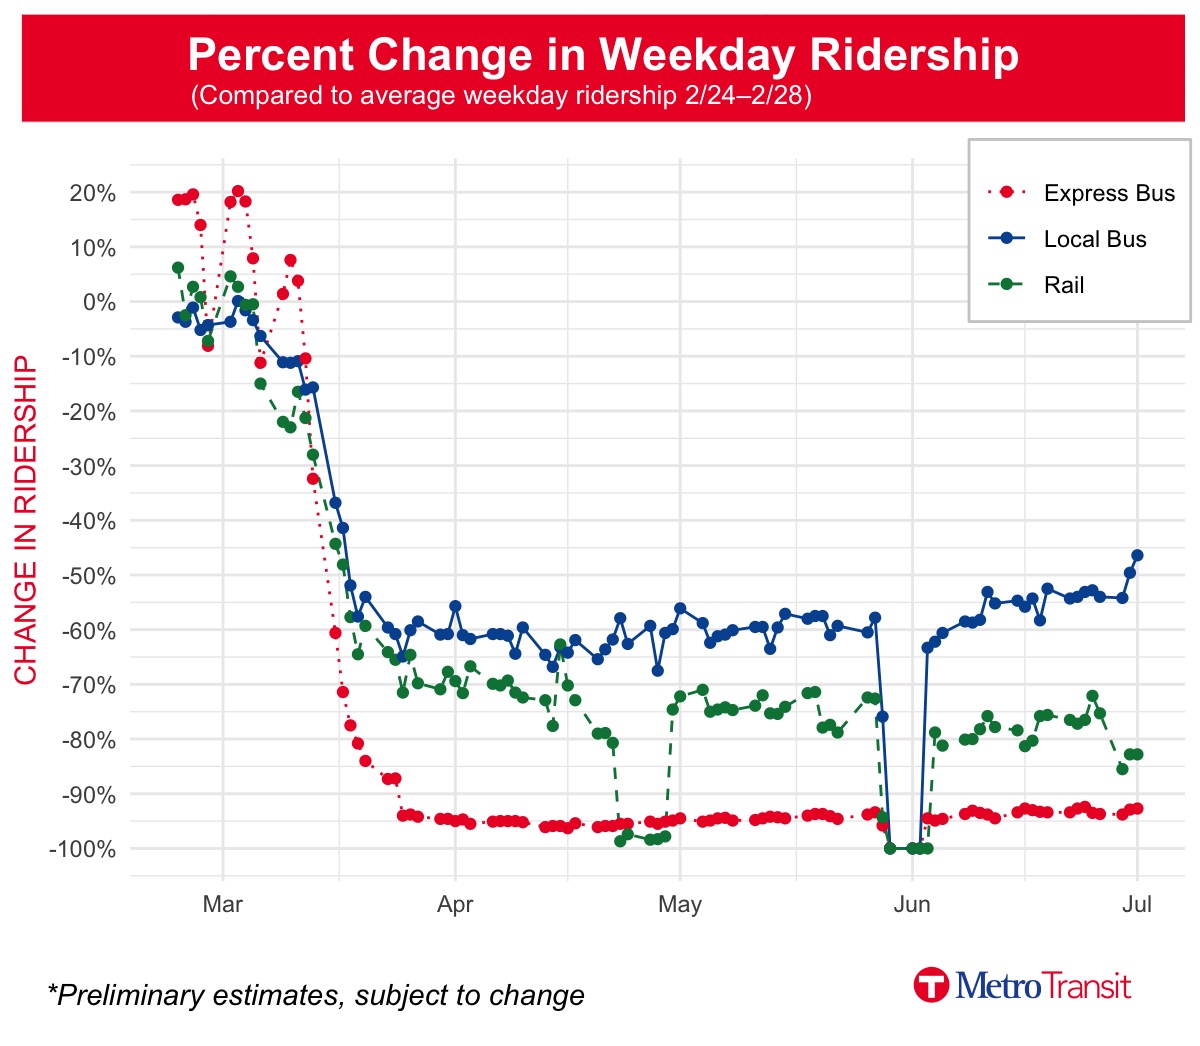 Figure 2: A graph of ridership trends, updated daily, shows a rapid decline in ridership in mid-March and a slow increase since mid-May.
Adjusting Schedules and Service
As remote work became more common, and a statewide stay-at-home order took effect, it became clear that some of our routes where barely being used anymore. Some of these routes were commuter bus routes that use the longer articulated buses (sometimes called accordion or double buses). To provide extra space for social distancing on routes that still had high ridership, we could reassign larger vehicles from these low ridership routes to routes with higher ridership.
To maximize space available for social distancing on transit we needed to know not just the routes that had lost riders, but which vehicles operating a run of trips could be reassigned. I was able to add information about runs to my ridership database and soon we had a daily update of ridership by run that allowed our service analysts and bus operations team to reassign the longer vehicles from runs with fewer riders to runs with the most overcrowding. The longer buses were quickly assigned to routes 5, 10, 18, 21, 22, 64 and 68, which were seeing the most overcrowding, and immediately reduced crowding. 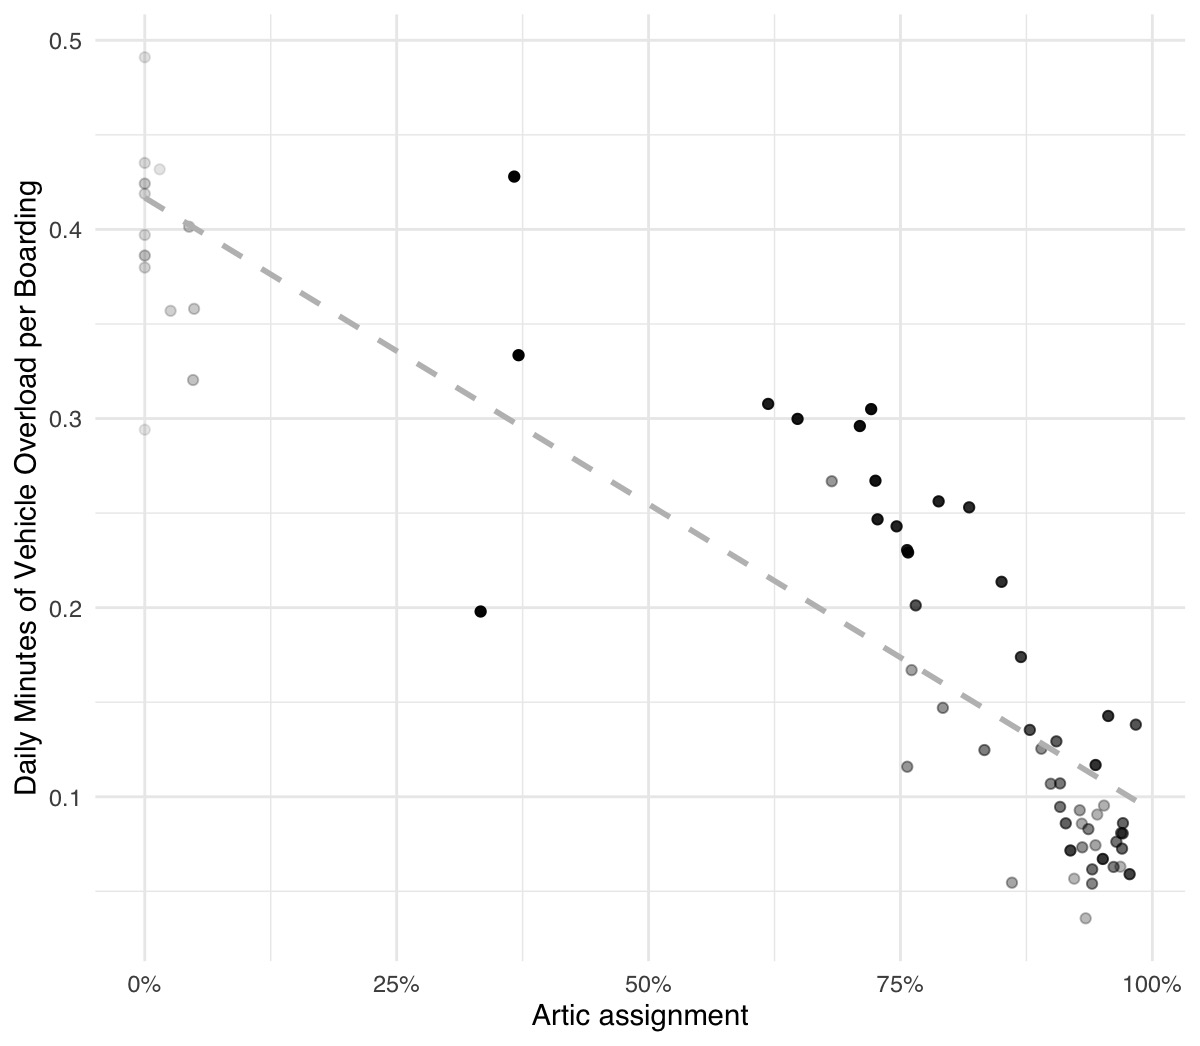
Figure 3: Assigning longer vehicles to Route 10 reduced overcrowding.
We continue to watch for trends in daily ridership and crowding. Since mid-May we’ve seen an increase in bus ridership, especially on our busiest routes. One interesting observation was that two morning runs on Route 17 were consistently overcrowded. With that information, the bus operations staff in the control center were able to create a new run to add two morning trips to Route 17 to reduce crowding (Nicollet Garage, which provides the buses for this route, does not have any articulated buses that could be used).
Not too bad for a dataset and tool that I thought might be “interesting.”
Metro Transit reports official ridership figures annually. To request additional information about ridership and other Metro Transit data, contact Public Relations Manager Howie Padilla at [email protected].