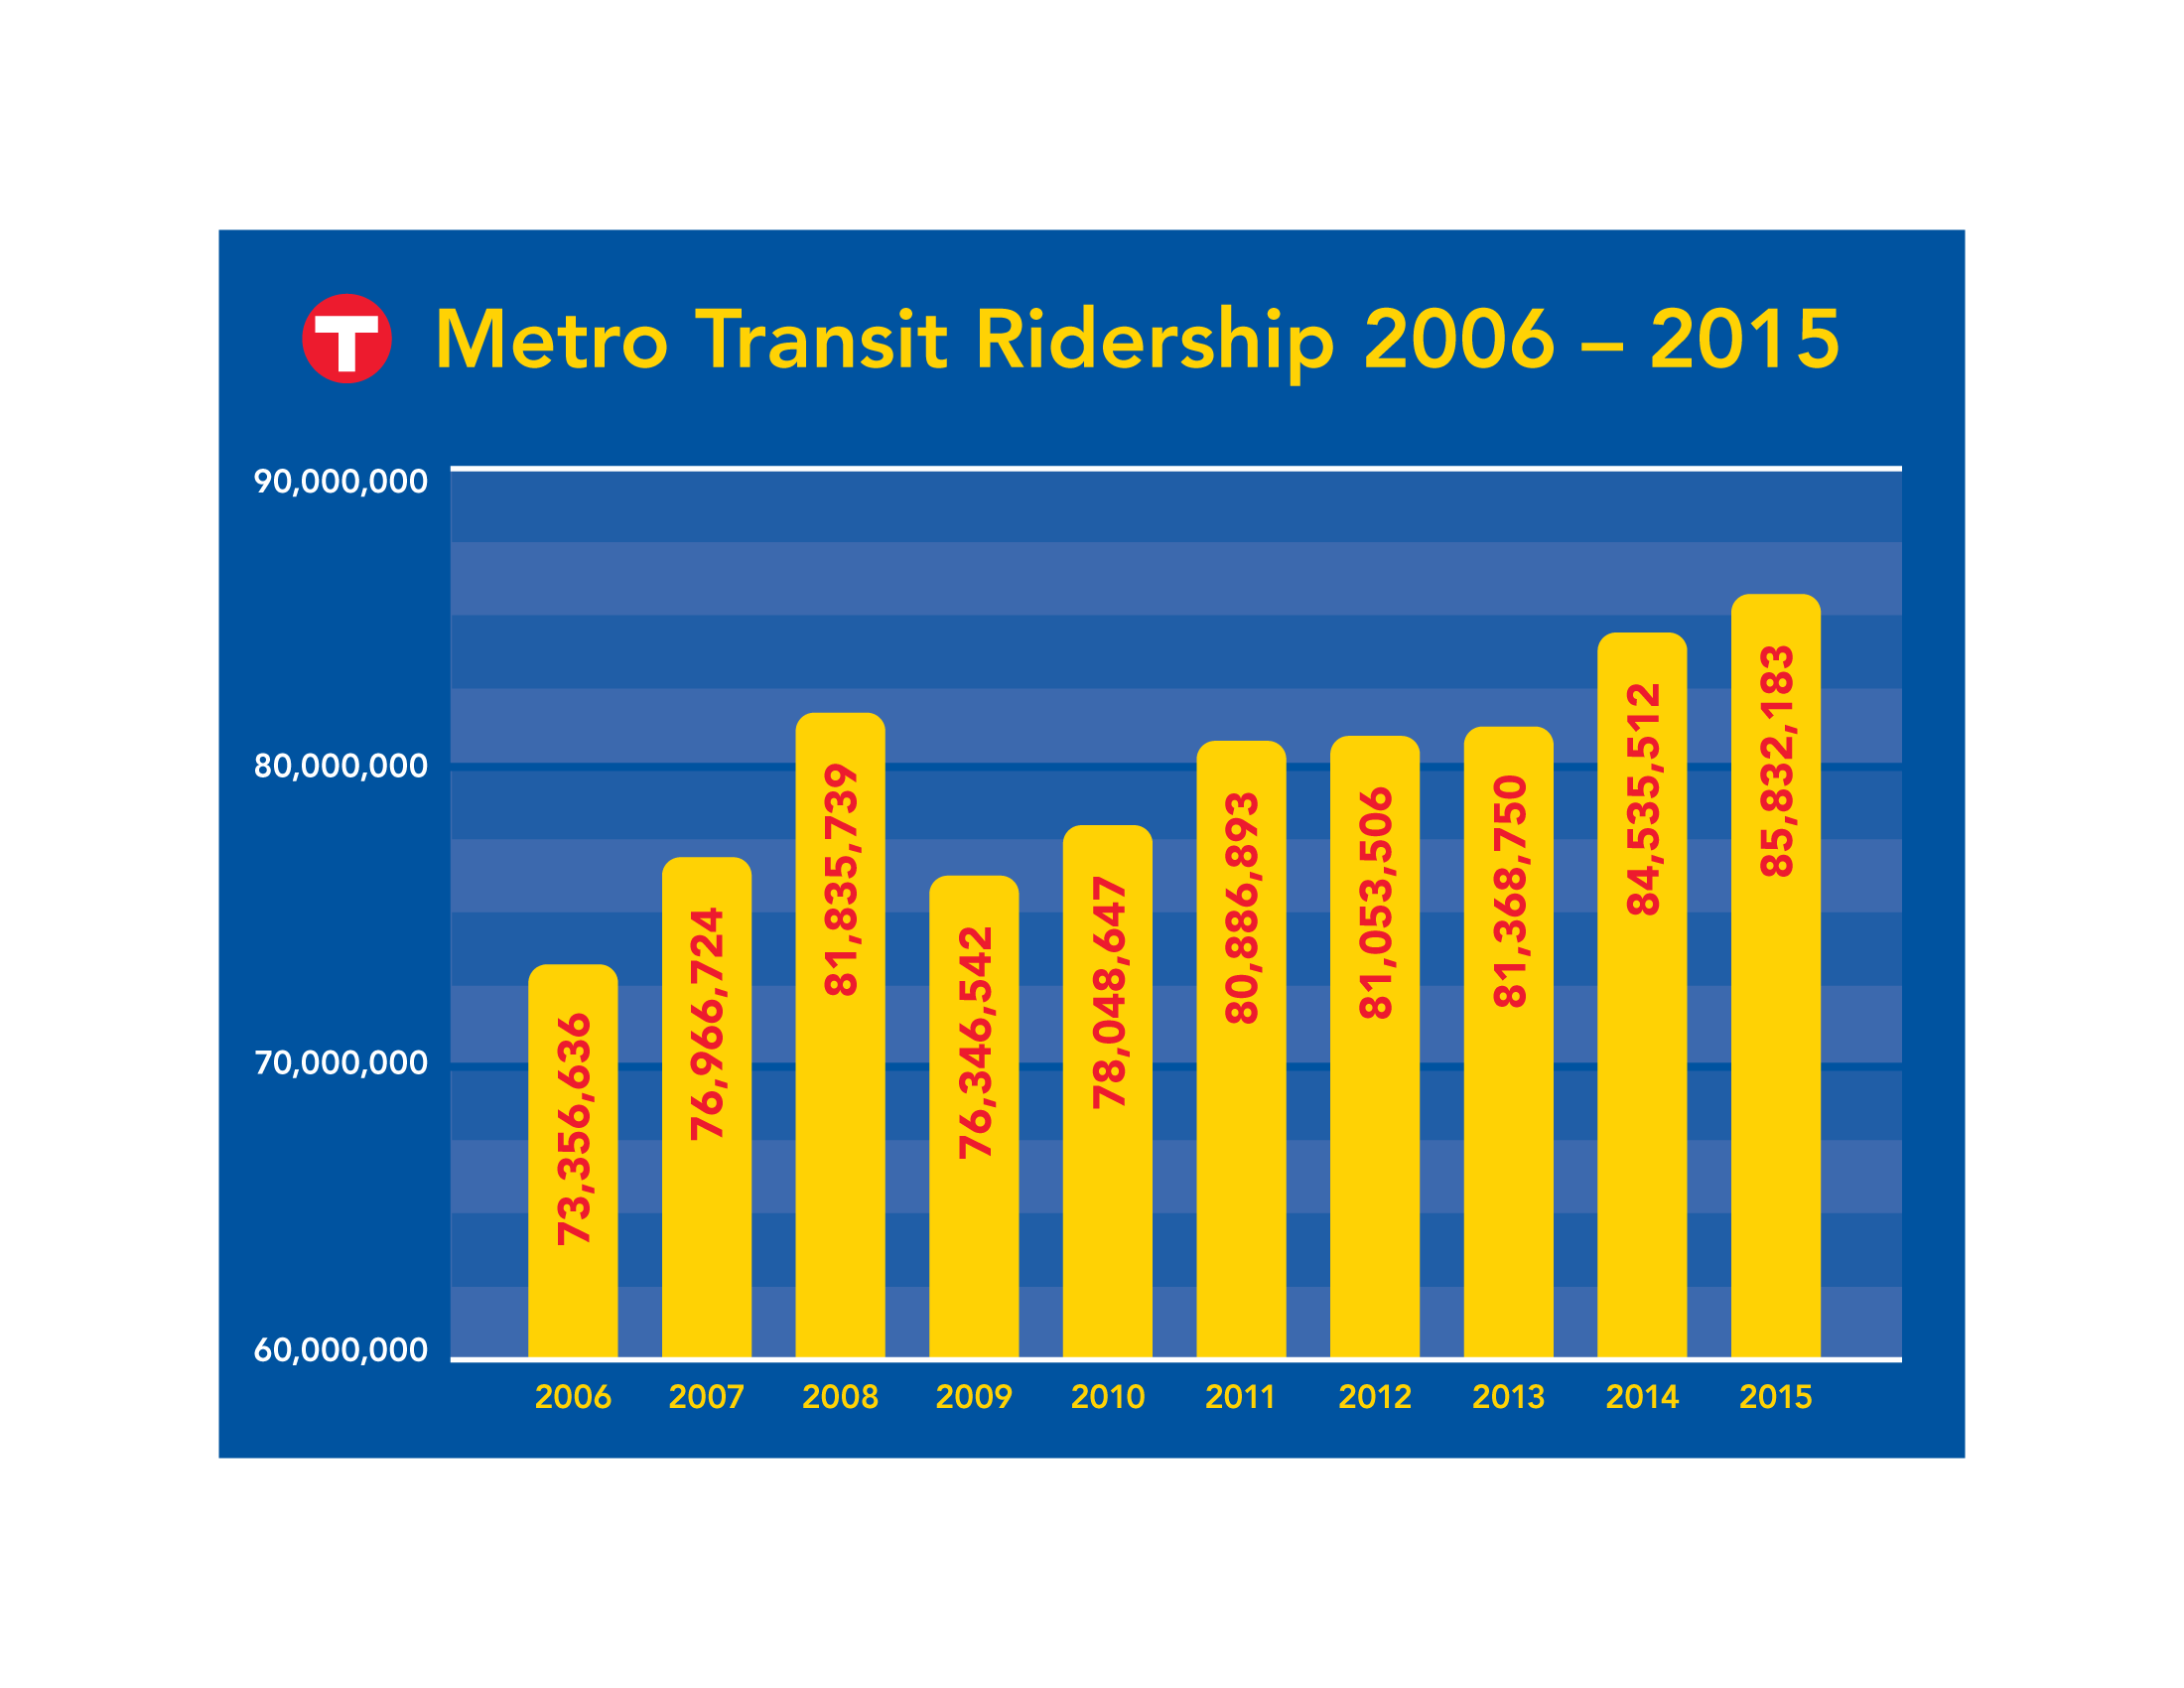
 The METRO Blue Line set a new annual ridership record and system ridership increased for the 11th time in 12 years as customers took more than 85.8 million rides on buses and trains operated by Metro Transit in 2015.
Ridership increased 1.4 percent over last year, by nearly 1.2 million rides, and reached its highest level since 1981. This is the first time in a generation that ridership has grown steadily for more than a decade; annual ridership has increased 23 percent since 2005.
“We’ve really turned a corner when it comes to transit in the Twin Cities,” General Manager Brian Lamb said. “With two light-rail lines, more than 100 bus routes and a commuter rail line, the Twin Cities is more connected than it’s been in a very long time. And the benefits are profound: improvements in our transit network are making our region more equitable, economically competitive and sustainable.”
Average weekday ridership on all modes in 2015 was approximately 276,400, including 205,000 average weekday bus rides.
Ridership on both the Blue and Green light-rail lines continued to grow as customers used the all-day, frequent service to travel to work, school, special events and other destinations. The ability to transfer between light-rail lines in downtown Minneapolis also boosted ridership.
In all, more than 10.6 million rides were taken on the Blue Line, the highest annual ridership since it opened in mid-2004. The previous record of nearly 10.5 million rides was set in 2010. Average weekday ridership topped 30,000 for eight consecutive months.
Nearly 12.4 million rides were taken on the Green Line during its first full year of operation. Average weekday ridership was 37,400 – just under the 2030 forecast of 41,000 rides. Ridership in the Central Corridor, including the Green Line and bus routes 16 and 94, increased by about 30 percent from 2014 to 2015 and has nearly doubled since 2013, when service was provided by buses alone.
There was an 8.6 percent decline in bus ridership, reflecting a transition from buses to light rail and construction that led to prolonged detours on multiple routes. In all, more than 62.1 million bus rides were taken last year, including nearly 51.3 million urban local rides, 8.7 million express rides and 2.1 million suburban local rides.
Efforts to build bus ridership will continue in 2016. Initiatives include new the opening of the region’s first arterial Bus Rapid Transit Line, the A Line, new bus stop signs with more information, more waiting shelters and a new mobile app.
Northstar ridership increased slightly over 2014, with 722,637 rides. December’s average weekday ridership was up 12 percent over the same month last year.
2015 Ridership By Mode
| |
2015 Rides |
Avg. Weekday Rides |
| Bus* |
62,106,089 |
204,986 |
| Green Line |
12,383,173 |
37,402 |
| Blue Line |
10,620,284
|
31,471
|
| Northstar |
722,637
|
2,548
|
| TOTAL |
85,832,183 |
276,408 |
* Includes Maple Grove Transit routes operated by Metro Transit.
2015 Ridership Highlights
Metro Transit is a service of the Metropolitan Council and is the region’s largest transportation provider.
Contact: Howie Padilla, Public Relations Manager, 612-349-7089, [email protected]